What are Systems Maps?
In today’s complex world,understanding and solving intricate problems requires more than just linear thinking. Systems maps are powerful tools that visualize the interconnections and interdependencies within a system. By providing a holistic view, systems maps enable us to identify leverage points, foresee unintended consequences,and foster a deeper understanding of the underlying dynamics.
Uses of Systems Maps
With the use of systems maps, we may locate leverage points in a system where minor adjustments can have a big influence by identifying important nodes and connections. They help us make well-informed decisions by helping us see relationships, which helps us anticipate unintended effects. A comprehensive understanding of complex systems is provided by systems maps, which is necessary for creating workable solutions. By simplifying difficult information into understandable diagrams and assisting stakeholders in reaching a consensus, they promote team collaboration and communication. Furthermore, systems maps improve our ability to think strategically by helping us see issues from several angles and take long-term implications into account. Systems maps help us maximize the effectiveness of our solutions by helping us comprehend and tackle complicated challenges more effectively.
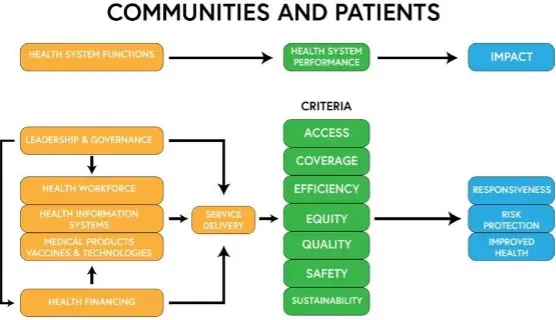
Image Source: Wordpress
5 Powerful Real-World Applications of Systems Maps
1.Improving Public Health
Visualizing the Web of Factors
Public health challenges, such as the spread of infectious diseases or chronic illnesses like diabetes, are influenced by a myriad of factors. Systems maps can illustrate the intricate web of determinants, including social, economic, environmental, and behavioral elements.
Case Study: Tackling Obesity
Obesity is a multifaceted issue impacted by diet, physical activity, genetics, socioeconomic status, and public policy. A systems map can reveal how these factors interact, highlighting potential intervention points. For instance, by visualizing how urban planning affects physical activity levels, policymakers can promote the development of parks and pedestrian-friendly infrastructure.
Benefits
• Identifying hidden relationships and feedback loops: By mapping out the factors influencing obesity, stakeholders can see how policies in one area (like food advertising) might impact behaviors in another (like physical activity).
• Prioritizing interventions with the highest impact: Systems maps help prioritize actions by showing which factors have the most significant influence.
• Facilitating collaboration among stakeholders from different sectors: Public health issues require multi-sectoral approaches, and systems maps provide a common platform for collaboration.
Implementation Steps
- Define Scope: Identify the specific public health issue to be addressed.
- **Data Collection: ** Gather data on all relevant factors, including socioeconomic, behavioral, and environmental aspects.
- Map Creation: Develop the systems map, highlighting key relationships and feedback loops.
- Analysis: Identify leverage points and potential interventions.
- Action Plan: Implement targeted interventions based on insights from the map.
2. Enhancing Business Strategy
Seeing the Big Picture
In the business world, companies often face complex challenges that cannot be resolved through simple cause-and-effect thinking. Systems maps help businesses visualize the broader ecosystem in which they operate, including competitors, suppliers, customers, and regulatory bodies.
Case Study: Supply Chain Management
Systems mapping was utilized by a multinational company to handle supply chain interruptions. Through a comprehensive supply chain mapping process, which encompasses downstream customers and suppliers’ suppliers, the organization was able to identify crucial points of failure. They were able to create backup plans, diversify their sources, and make investments in more durable infrastructure thanks to this realization.
Benefits
- Better risk management and resilience planning: Systems maps help businesses anticipate and mitigate risks by visualizing interdependencies and potential vulnerabilities.
- More informed strategic decision-making: By understanding the broader ecosystem, companies can make more strategic and informed decisions.
- Improved stakeholder communication and alignment: Systems maps provide a visual tool for communicating complex relationships to stakeholders, fostering better alignment and collaboration.
Implementation Steps
- Define Objectives: Clarify the strategic goals and challenges to be addressed.
- Data Collection: Gather data from across the supply chain, including inputs from suppliers, customers, and internal processes.
- Map Creation: Develop a comprehensive systems map of the supply chain.
- Risk Analysis: Identify vulnerabilities and critical nodes within the supply chain.
- Action Plan: Develop and implement strategies to address identified risks and improve resilience.
3. Advancing Environmental Sustainability
Understanding Ecological Interactions
Environmental issues, such as climate change, biodiversity loss, and pollution, involve complex interactions within ecosystems. Systems maps can illustrate these interactions, helping to identify key leverage points for sustainable interventions.
Case Study: Watershed Management
Environmental scientists employed systems mapping to see how land use, water quality, and biodiversity interacted in an effort to restore a damaged watershed. The map demonstrated the relationship between agricultural practices upstream and downstream on water quality, which prompted focused initiatives that supported riparian buffer zones and sustainable farming methods.
Benefits
- Holistic understanding of environmental challenges: Systems maps provide a comprehensive view of ecological interactions, helping to identify key leverage points for intervention.
- Enhanced ability to design effective conservation strategies: By visualizing the complex interactions within ecosystems, stakeholders can design more effective and sustainable conservation strategies.
- Support for collaborative efforts across different sectors and communities: Environmental challenges require collaboration across sectors and communities, and systems maps provide a common platform for this collaboration.
Implementation Steps
- Define Scope: Identify the specific environmental issue and geographic area to be addressed.
- Data Collection: Gather data on ecological, social, and economic factors.
- Map Creation: Develop a systems map illustrating the interactions between these factors.
- Analysis: Identify key leverage points and potential interventions.
- Action Plan: Implement targeted interventions based on insights from the map.

4. Improving Education Systems
Addressing Systemic Challenges
Education systems are influenced by a multitude of factors, including socioeconomic status, teacher quality, curriculum design, and policy frameworks. Systems maps can provide a comprehensive view of these factors and their interactions.
Case Study: Reducing School Dropout Rates
A school district used systems mapping to address high dropout rates. The map revealed that dropout rates were influenced by factors such as student engagement, parental involvement, teacher support, and extracurricular activities. By identifying key leverage points, the district implemented targeted interventions, such as mentorship programs and parental engagement initiatives, leading to a significant reduction in dropout rates.
Benefits
- Identifying root causes of systemic issues: Systems maps help identify the root causes of challenges within the education system.
- Designing targeted and effective interventions: By visualizing the complex interactions within the system, stakeholders can design more targeted and effective interventions.
- Fostering collaboration among educators, policymakers, and communities: Education challenges require collaboration across sectors, and systems maps provide a common platform for this collaboration.
Implementation Steps
- Define Objectives: Identify the specific education challenge to be addressed.
- Data Collection: Gather data on relevant factors, including socioeconomic, behavioral, and policy aspects.
- Map Creation: Develop a systems map illustrating the interactions between these factors.
- Analysis: Identify key leverage points and potential interventions.
- Action Plan: Implement targeted interventions based on insights from the map.
5. Enhancing Policy Development
Managing intricate social structures with several stakeholders and interdependencies is frequently required while developing policy. Policymakers can create more informed and successful policies by using systems maps to represent these complexities.
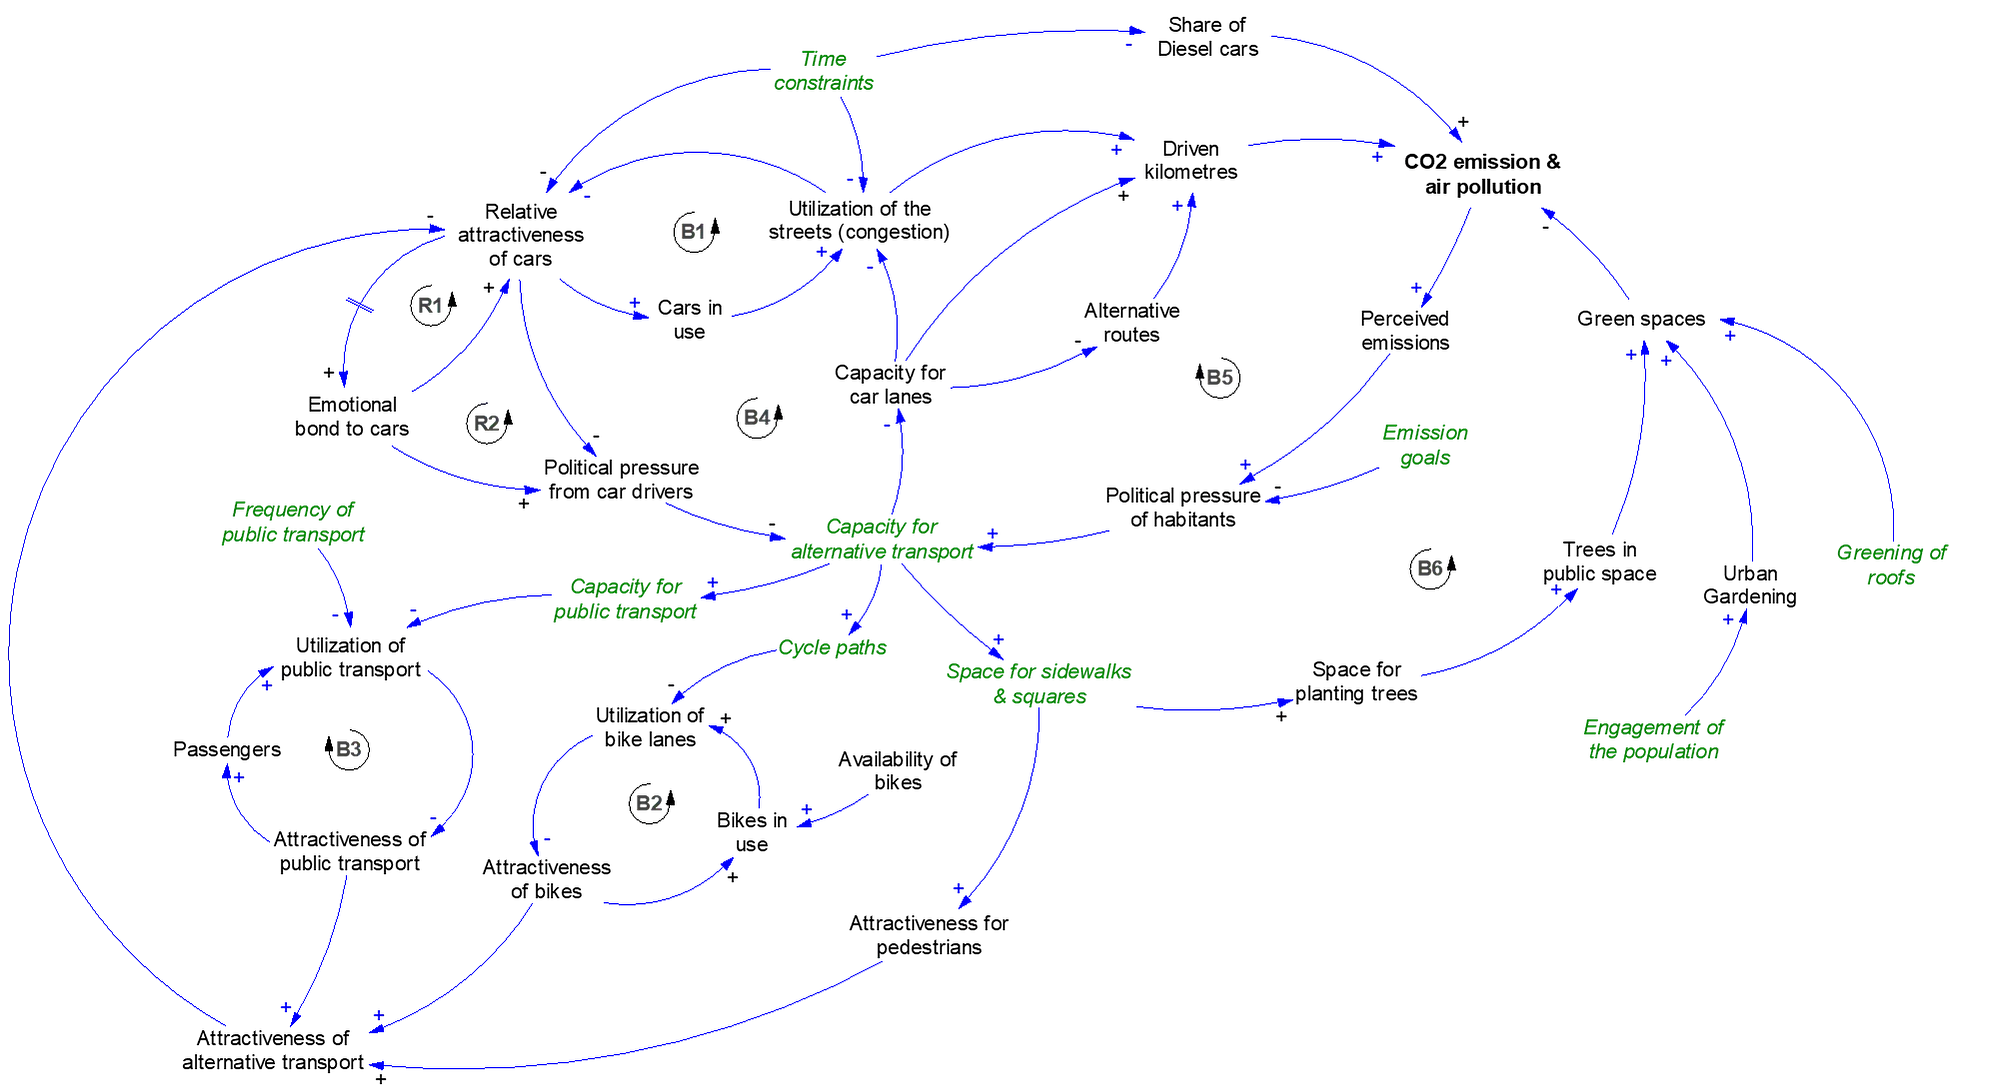
Case Study: Urban Transportation Planning
In developing a sustainable urban transportation plan, city planners used systems mapping to understand the interactions between transportation modes, traffic patterns, air quality, and public health. The map revealed how promoting public transit and cycling infrastructure could reduce traffic congestion and improve air quality. This holistic view enabled the development of a comprehensive and sustainable transportation policy.
Benefits
- Informed and holistic policy development: Systems maps help policymakers develop more informed and holistic policies by visualizing the complex interactions within social systems.
- Identification of unintended consequences and potential trade-offs: By visualizing the broader system, policymakers can anticipate and mitigate unintended consequences and potential trade-offs.
- Enhanced stakeholder engagement and buy-in: Systems maps provide a visual tool for communicating complex relationships to stakeholders, fostering better engagement and buy-in.
Implementation Steps
- Define Policy Goals: Clarify the specific policy goals and challenges to be addressed.
- Data Collection: Gather data on relevant factors, including social, economic, and environmental aspects.
- Map Creation: Develop a systems map illustrating the interactions between these factors.
- Analysis: Identify key leverage points and potential policy interventions.
- Action Plan: Develop and implement policies based on insights from the map.
How to Harness the Full Potential of Systems Maps
Step 1: Define the Scope and Purpose
Clearly define the scope and purpose of the systems map. Determine the specific problem or challenge you are addressing and identify the key elements and relationships to include.
Step 2: Gather and Validate Data
Collect data from multiple sources to ensure a comprehensive view. Engage stakeholders and experts to validate the accuracy and relevance of the information.
Step 3: Visualize and Iterate
Create the initial systems map and iterate based on feedback and new insights. Use visual tools and software to enhance clarity and usability.
Step 4: Identify Leverage Points
Analyze the systems map to identify key leverage points where interventions can have the most significant impact. Consider both short-term and long-term effects.
Step 5: Implement and Monitor
Develop and implement interventions based on the insights gained from the systems map. Continuously monitor the outcomes and update the map as needed to reflect changes and new information.
The Limitations of Systems Maps
Systems maps are useful tools for illustrating the parts and connections inside a system, giving clarity and understanding into the workings of intricate systems. Systems maps offer a number of advantages, but they also have certain drawbacks. By being aware of these restrictions, we can make better use of systems maps and, when needed, augment them with other resources.
- Complexity and Detail Constraints: Systems maps can become overly complex and hard to understand when attempting to cover all components and relationships within a system. When a systems map is too detailed, it can overwhelm the observer, making it difficult to identify the key elements.
- Difficulty in Capturing Dynamic Changes: Systems maps are typically static representations, which makes it challenging to reflect the dynamic nature of systems. In real-world scenarios, components and relationships within a system often change over time, and static maps cannot adequately capture these changes.
- Subjectivity: The creation of systems maps often depends on the perspective and understanding of the person making them. Different individuals might produce varying maps for the same system, introducing subjectivity that can lead to bias or misinterpretation.
- Challenges in Representing Nonlinear Relationships: Many systems involve nonlinear relationships where inputs and outputs are not directly proportional. Systems maps may struggle to effectively portray these complex, nonlinear interactions, potentially oversimplifying the system’s behavior.
- Ignoring External Environmental Influences: Systems maps usually focus on internal components and relationships, potentially overlooking the influence of the external environment. External factors can significantly impact system behavior, and neglecting these can lead to incomplete or inaccurate analysis.
- Difficulty in Updating and Maintenance: As systems evolve, systems maps need continuous updating and maintenance to remain accurate. This process can be time-consuming and cumbersome, particularly for large and complex systems.
- Information Overload: There is limited space in a systems map to convey information. Attempting to include too many details can make the map overly cluttered and detract from its clarity and usefulness.
- Unsuitability for All Types of Systems: Some systems, especially those with high levels of abstraction or uncertainty, are difficult to represent effectively with systems maps. Social or psychological systems, for example, may involve complex relationships that are not easily captured in a simple visual diagram.
With the use of systems maps, stakeholders can better understand the interdependencies and complexities of different systems, find areas of leverage, foresee unforeseen repercussions, and make well-informed decisions. They have demonstrated their efficacy in a variety of contexts, including public health, corporate strategy, environmental sustainability, education system improvement, and policy formulation. It’s crucial to understand their limitations, though, which include subjectivity, static nature, and complexity. Clarity in defining the scope and goal, data collection and validation, visualization and iteration, identification of leverage points, and ongoing monitoring and updating of the maps are essential for maximizing their potential. Stakeholders may effectively solve complicated challenges and bring about significant change across various areas by doing this.


![[5 Powerful Real-World Applications of Systems Maps]: How to Harness Their Full Potential](/_astro/111.QyzGyYJm_ZMmtzR.webp)

.BOgX9RtS_ZU8DN8.webp)