
[7 Amazing Tips for Expert Concept Map Creation]: A Complete Guide
A complete guide to creating effective and visually appealing concept maps with expert tips.

Education Consultant
Anna Xue · 9/8/2024 · 8 min read ![[7 Amazing Tree Map Examples] How to Unlock Powerful Visualizations for Your Data](/_astro/7 Amazing Tree Map Examples How to Unlock Powerful Visualizations for Your Data.R0VnfKPP_l9Odg.webp)
Tree maps are one of the most powerful tools for visualizing hierarchical data. Their ability to display vast amounts of information in a compact and visually appealing way makes them invaluable for data analysts, UX/UI designers, and anyone who needs to present complex datasets in an easily understandable format. In this blog post, we’ll explore seven creative tree map examples that not only showcase the versatility of this visualization technique but also offer inspiration for your next project.
Tree maps are particularly advantageous for visualizing financial data, allowing for a clear representation of asset distribution across various categories. For example, if you’re managing a diverse portfolio that includes stocks, bonds, real estate, and other investments, a tree map can display the allocation of these assets visually. The size of each block correlates with the value of the investment, making it easy to see which areas are most significant. This tool is essential for portfolio managers who need a swift and clear overview of their assets.
What makes this tree map approach truly remarkable is its ability to convert complex financial data into an easily understandable, at-a-glance view. Investors can quickly pinpoint which sectors dominate their portfolio, facilitating more informed and strategic adjustments. This visualization tool not only simplifies the analysis but also enhances the overall clarity of financial data, making it an invaluable asset in portfolio management.

Image from: Wondershare EdrawMax
For digital marketers and web developers, gaining insights into user behavior on a website is essential. A tree map can effectively break down the different pages or sections of a website based on user visits. Each block in the tree map represents a specific page, with its size reflecting the number of visits that page receives. This visualization provides a clear overview of how users interact with the site, making it easier to identify popular areas and those that need improvement.
This tree map approach is powerful because it offers a game-changing method for optimizing website performance. By visually identifying the most and least visited areas, you can focus on enhancing user experience and streamlining navigation. This insight allows you to direct your content creation efforts where they matter most, ensuring that your website meets user needs more effectively and drives better engagement.
In project management, tracking tasks and time allocation across various teams and departments is essential for success. A tree map provides a bird’s-eye view of task distribution, allowing project managers to see where resources are concentrated. Each block in the tree map can represent a different team or task, with its size reflecting the amount of time or resources dedicated to it. This visualization helps in understanding how tasks are spread across the project, making it easier to manage workloads effectively.
This tree map approach is particularly amazing because it allows project managers to quickly assess which teams are overloaded and which may have the capacity to take on additional work. By visually identifying these imbalances, managers can allocate resources more efficiently and plan projects with greater precision. This tool not only improves task management but also ensures that resources are used optimally, leading to better project outcomes.

Image from: Microsoft Bing
Content creators often face challenges in organizing their ideas and strategies effectively. A tree map can serve as a valuable tool by visually mapping out different content themes, topics, or categories. This representation makes it easy to identify which areas are well-covered and which may require more attention, helping to streamline the content creation process and ensuring that all ideas are effectively organized.
This tree map approach is particularly powerful for content strategists and marketers who need to maintain a balanced and comprehensive content plan. By providing a clear overview of content distribution, it helps ensure that all relevant topics are covered without overemphasizing any single area. This visual tool supports a more strategic approach to content creation, leading to a more effective and well-rounded content strategy.
Tree maps are a powerful tool for sales teams, providing a clear visualization of product performance across various categories. Each product or category is represented by a block, with its size reflecting the sales volume. This allows sales teams to quickly identify which products are driving revenue and which ones may need reevaluation, offering a comprehensive overview of the product portfolio’s strengths and weaknesses.
This tree map approach is amazing because it gives sales teams a clear visual understanding of their top-performing products and those that may require strategic adjustments. By highlighting the products that contribute most to revenue, sales teams can focus their efforts on optimizing and boosting overall sales effectiveness, ensuring a more targeted and successful sales strategy.
Image from: Creately
For marketers, understanding customer segments is crucial for creating targeted and effective campaigns. A tree map can serve as an excellent tool for visualizing different customer segments based on factors like demographics, purchasing behavior, or other relevant criteria. Each block in the tree map represents a segment, with its size corresponding to the proportion of the customer base it represents, offering a clear view of the customer landscape.
This tree map approach is powerful because it enables marketers to tailor their strategies to different customer segments with precision. By clearly identifying the most significant customer groups, marketers can focus their efforts on the most lucrative markets, thereby increasing the likelihood of higher campaign success rates and more effective resource allocation.
Academics often face the challenge of managing large volumes of research papers and articles. A tree map can be an effective tool for visualizing the relationships between different research topics or themes. In this visualization, each block represents a paper, with its size indicating the number of citations or its relevance within the field. This approach provides a clear overview of how various topics are interconnected, making it easier to manage and categorize research.
This tree map approach is amazing because it helps researchers keep track of the most influential papers and emerging trends within their field. By visually identifying key works and their relationships, researchers can streamline the literature review process, ensuring that their work is organized, comprehensive, and impactful. This tool ultimately supports more effective research and a deeper understanding of the field.
Image from: THINKING MAPS
Creating a tree map is a straightforward yet powerful way to visualize hierarchical data. The process begins with preparing a well-organized dataset where categories and subcategories are clearly defined. After organizing your data, select a suitable tool such as Microsoft Excel, Tableau, or Datawrapper to create your tree map. Import your data into the tool, generate the basic tree map, and then customize it by adjusting elements like colors, labels, and layout. This customization ensures that your tree map effectively communicates the key insights. Once your tree map is complete, take time to analyze the visualized data, looking for patterns, trends, and outliers that might not be immediately obvious from raw data. Finally, share your tree map either as an image or through an interactive platform, making sure to keep the design simple, consistent in color, and easy to read. With these steps, you can create an impactful tree map that enhances data understanding and supports better decision-making.
Tree maps are an essential tool for anyone dealing with large, hierarchical datasets. Their ability to condense complex information into a visually appealing and easy-to-understand format makes them invaluable across various fields, from finance to marketing to academia. The seven examples we’ve explored demonstrate the versatility and power of tree maps, showing just how impactful they can be in helping you make data-driven decisions. By incorporating tree maps into your data visualization toolkit, you’ll be able to present information in a way that’s not only informative but also engaging and visually compelling. Whether you’re analyzing financial data, planning content strategies, or managing projects, tree maps offer a powerful way to unlock insights and drive success.
A complete guide to creating effective and visually appealing concept maps with expert tips.
Education Consultant
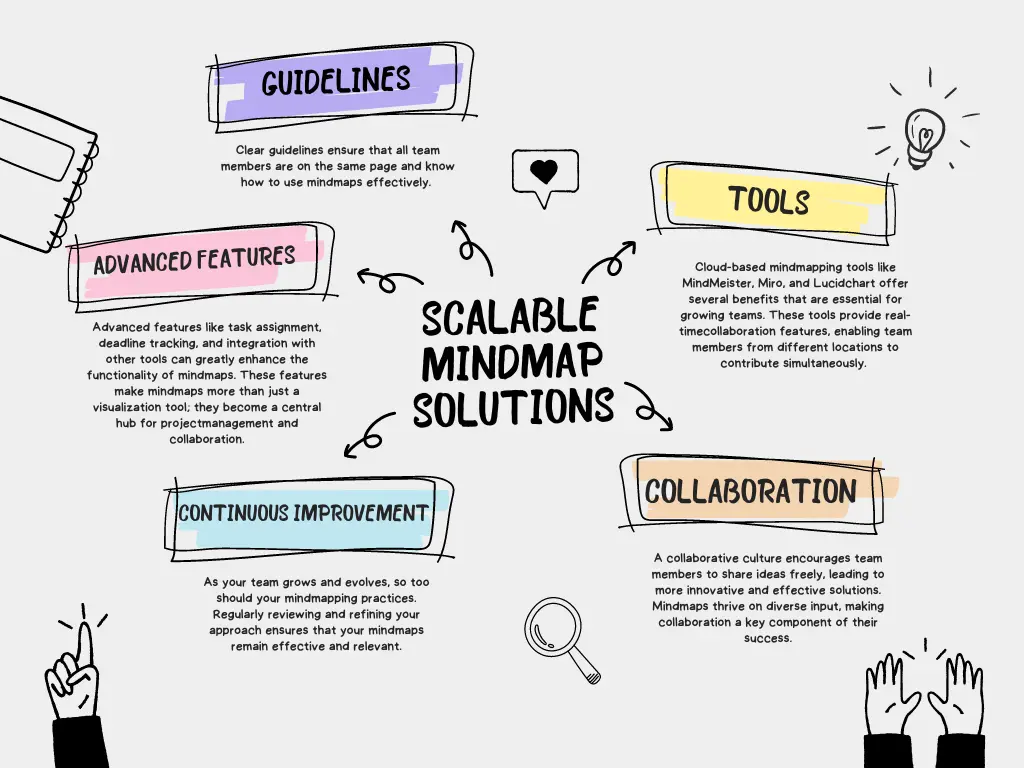
Discover five strategies to create scalable mindmap solutions that will supercharge your team's collaboration and growth.
Education Consultant

Learn expert tips on how to use mindmaps effectively to enhance your memory and recall abilities. This blog provides practical advice on how to organize information visually, making it easier to remember complex concepts.
Education Consultant