When organizing complex information, visual tools can be incredibly effective. Among these tools, the spider map and radial map are two popular choices. While they may appear similar at first glance, they serve different purposes and are used in distinct ways. In this blog, we’ll explore the differences between spider maps and radial maps, their unique applications, and how to choose the right tool for your needs.
A spider map, also known as a spider diagram or web diagram, is a visual representation used to organize ideas or concepts around a central theme. It resembles a spider’s web, where the central idea is the hub, and related concepts radiate outward like spider legs. Each leg represents a different aspect or subtopic related to the central theme.
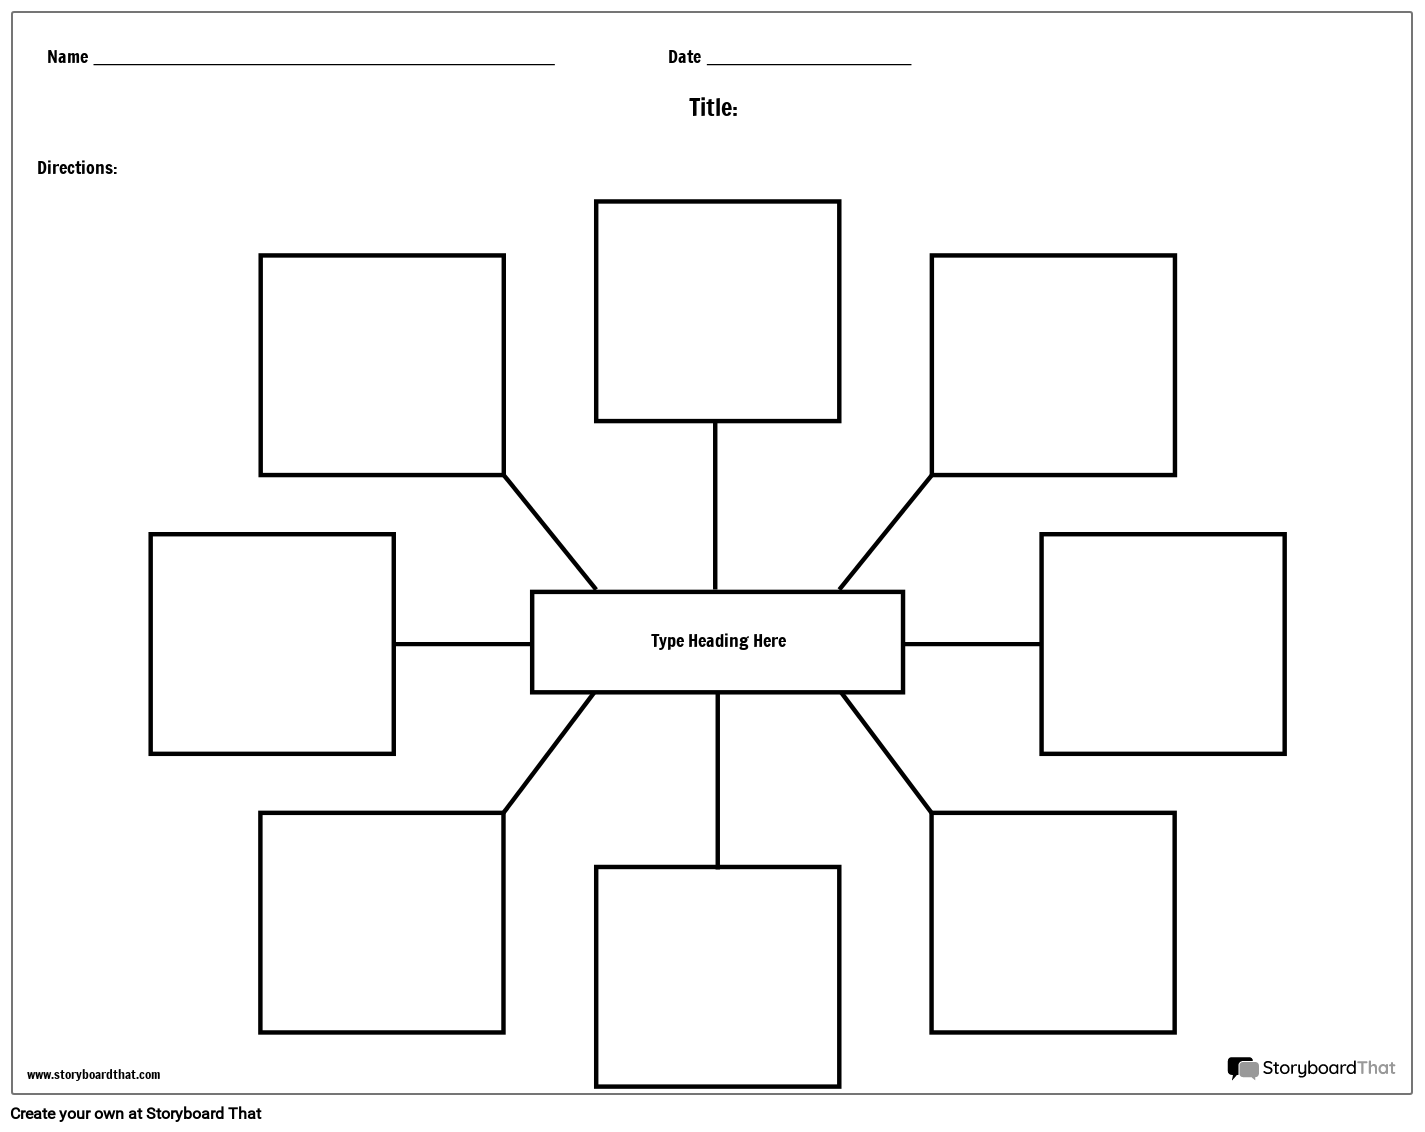
Image from:Storyboard That
Key Features of Spider Maps:
- Central Node: The central concept or theme is placed in the middle.
- Branching Structure: Related ideas extend from the center, forming branches.
- Flexible: It can accommodate a wide range of information and connections.
Applications of Spider Maps:
- Brainstorming: Useful for generating and organizing ideas in a non-linear way.
- Project Planning: Helps outline project components and their relationships.
- Educational Purposes: Assists in understanding and organizing study material.
A radial map, often referred to as a radial diagram or radial chart, is another type of visual tool that centers around a core idea. However, instead of resembling a spider’s web, a radial map typically has a more structured appearance with concentric circles or segmented layers. Each layer represents different levels of information or categories related to the central theme.
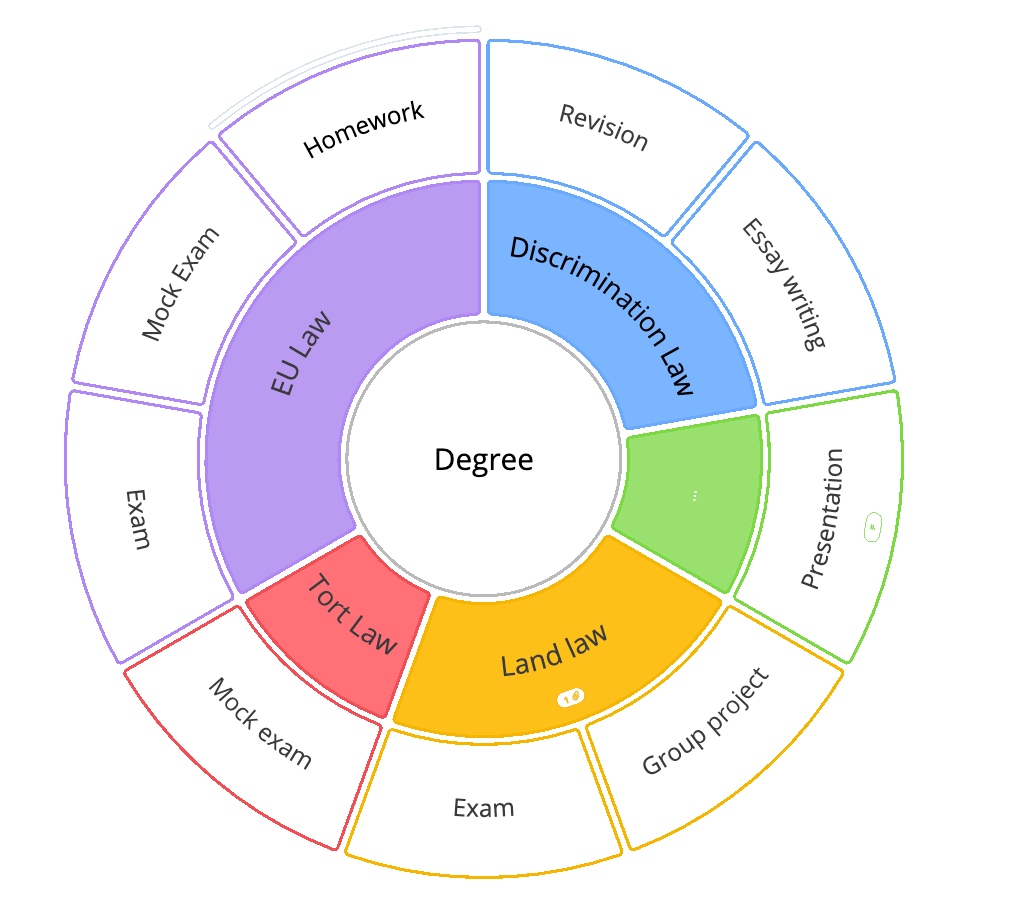
Image from:Vrogue.co
Key Features of Radial Maps:
- Central Core: The main idea is placed at the center.
- Concentric Circles: Information is arranged in layers around the central core, representing different levels of detail or categories.
- Structured Layout: Provides a more organized view of how different elements relate to the central idea.
Applications of Radial Maps:
- Hierarchical Organization: Useful for displaying hierarchical relationships or categorizing information.
- Data Visualization: Effective for showing relationships between data points in a structured manner.
- Strategic Planning: Helps in visualizing strategic components and their interconnections.
Comparing Spider Maps and Radial Maps
1. Structure and Layout:
- Spider Map: Non-hierarchical, with branches radiating out from the central node. It’s ideal for free-flowing ideas and connections.
- Radial Map: Hierarchical or layered, with concentric circles or segments. It’s better for structured, categorical information.
2. Use Cases:
- Spider Map: Best for brainstorming sessions, idea generation, and organizing complex information with multiple interconnections.
- Radial Map: Suitable for visualizing hierarchical relationships, categorizing detailed data, and strategic planning.
3. Visual Representation:
- Spider Map: More organic and flexible, resembling a web.
- Radial Map: More structured, with clear layers or segments around a central core.
Here’s a comparison chart for Spider Maps and Radial Maps to help visualize their differences and applications:
| Feature | Spider Map | Radial Map |
|---|
| Structure | Central node with branches extending outward | Central core with concentric circles or layers |
| Appearance | Resembles a spider’s web | Resembles concentric rings or segments |
| Primary Use | Brainstorming, idea generation, non-linear organization | Hierarchical organization, data visualization, structured information |
| Key Features | Central theme- Flexible branches- Non-hierarchical | - Central core- Concentric layers- Hierarchical or structured layout |
| Best For | - Free-flowing ideas- Mapping complex relationships | - Categorizing data- Showing detailed hierarchies |
| Visual Representation | Organic, web-like | Structured, layered |
| Application Examples | - Project planning- Educational outlines- Creative brainstorming | - Strategic planning- Data charts- Organizational structures |
Example: Organizing a Marketing Campaign
Let’s consider an example to illustrate the choice between these two maps: organizing a marketing campaign.
- Using a Spider Map:
- Scenario: You are brainstorming ideas for a new marketing campaign. You want to explore various aspects like target audience, marketing channels, key messages, and campaign goals.
- Application: A spider map can be highly effective here. Place the central theme “Marketing Campaign” in the center. From there, branch out to various related elements such as “Target Audience,” “Marketing Channels,” “Budget,” and “Key Messages.” Each of these branches can further expand into more detailed subtopics. This flexible structure allows you to see how different components relate and interact with one another.
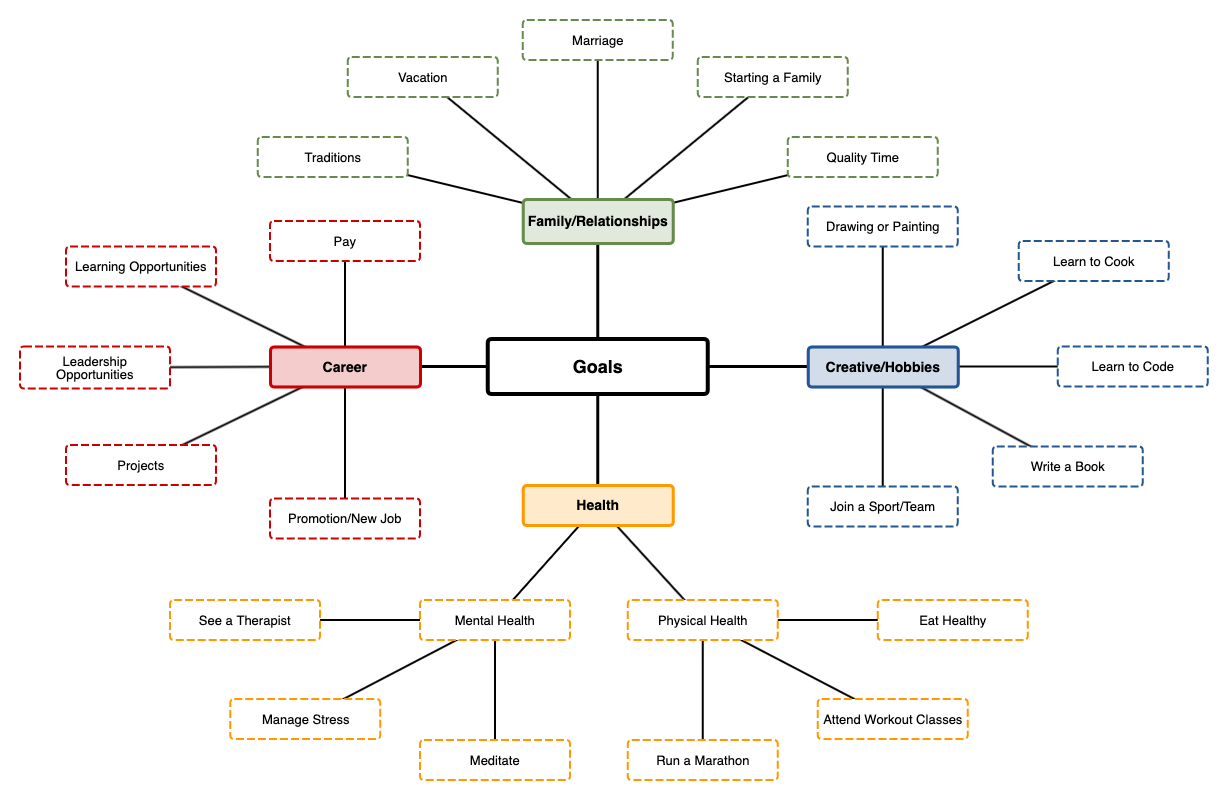
Image from:gliffy
- Using a Radial Map:
- Scenario: You are developing a strategic marketing plan and need to categorize and prioritize various components of the plan, such as goals, strategies, tactics, and metrics.
- Application: A radial map is suitable for this purpose. Place “Marketing Strategy” at the center. Surround it with concentric circles representing different layers such as “Strategic Goals,” “Tactical Plans,” and “Performance Metrics.” Each layer can further break down into more specific details. This structured approach helps in visualizing the hierarchy and the relationship between various strategic elements.

Image from:https://www.youtube.com/watch?v=qTEz_8WuIk4
Conclusion
Both spider maps and radial maps are valuable tools for visualizing information, each offering unique benefits depending on your needs. Understanding the differences between these two types of diagrams will help you choose the right tool for your project, ensuring effective communication and organization of ideas. Whether you’re brainstorming, planning, or analyzing data, these visual tools can enhance your ability to process and present information efficiently.


.DHf_86pa_fvIJu.webp)