In the realm of problem-solving and quality improvement, the Fishbone Diagram (also known as the Ishikawa Diagram) and Root Cause Analysis (RCA) are fundamental tools. Each offers unique methods for diagnosing and addressing issues, but they serve different purposes and are often used in tandem. This blog provides a comprehensive comparison, detailed explanations, and practical examples to help you understand and apply these tools effectively.
The Fishbone Diagram is a visual tool used to identify, explore, and display the potential causes of a specific problem. Its structured format helps teams analyze complex issues by breaking them down into manageable categories.

Image from:Edit.org
Key Characteristics:
- Visual Layout: Resembles a fish skeleton, with the problem at the head and branches representing major cause categories.
- Categories: Common categories include People, Processes, Materials, and Environment. These categories help in systematically exploring different potential causes.
- Focus: Emphasizes the relationship between the problem and various contributing factors.
Common Uses:
- Quality Management: Identifies quality issues and their potential causes in manufacturing and service industries.

Image from:Joshua Davis
- Process Improvement: Analyzes inefficiencies or problems in processes to find and address underlying causes.
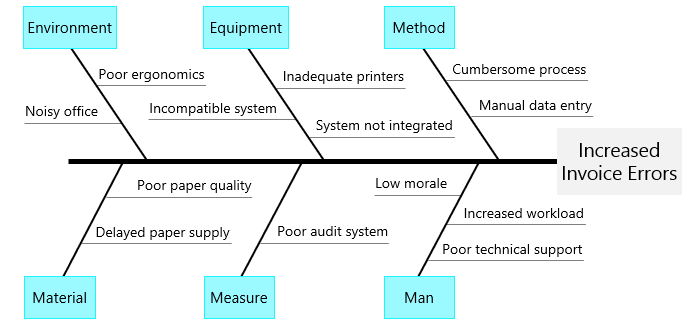
Image from:Mavink
- Problem-Solving: Helps teams organize thoughts and identify potential causes in a structured manner.
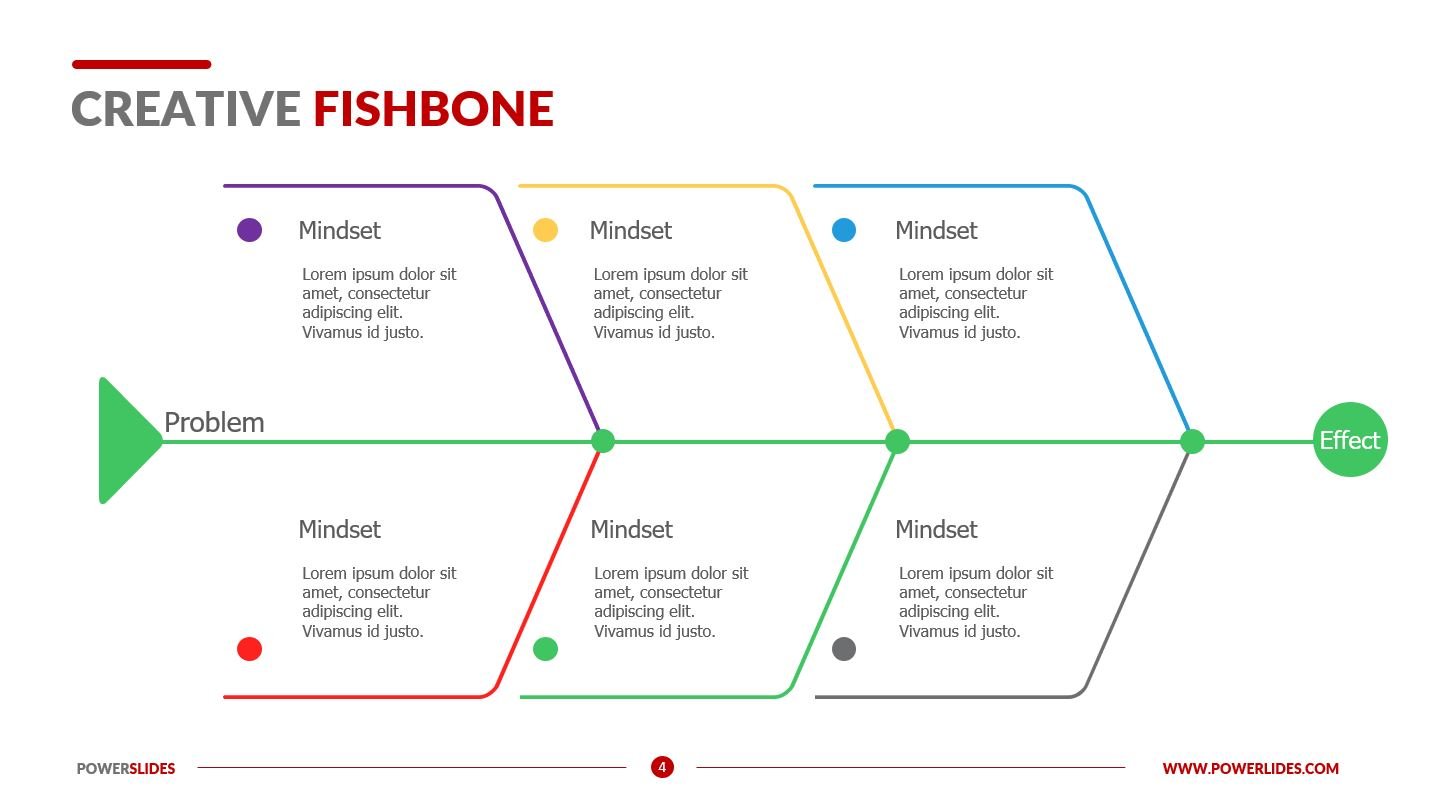
Image from:Powerslide
Visual Details:
- Head: Represents the core problem or effect.
- Spine: Central line connecting to the problem.
- Main Branches: Major categories of causes.
- Sub-branches: Detailed causes within each category.
Applications:
- Manufacturing: Used to analyze defects and determine the root causes of quality issues. For example, a manufacturing plant might use a Fishbone Diagram to investigate why a particular batch of products failed to meet quality standards.
- Service Industry: Helps in understanding factors affecting service delivery. For instance, a customer service team might use this tool to identify reasons for delays in service response times.
- Healthcare: Applied to improve patient care and safety. Hospitals might use Fishbone Diagrams to explore causes of medication errors or patient readmission rates.
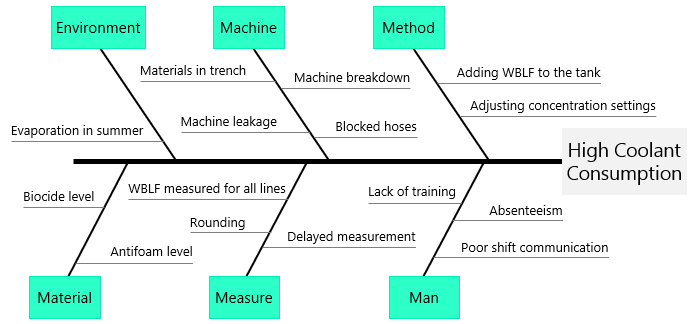
Image from:kit
Root Cause Analysis (RCA) is a broader methodology aimed at uncovering the fundamental causes of problems to prevent recurrence. RCA involves various techniques, including the Fishbone Diagram, to conduct a thorough investigation.
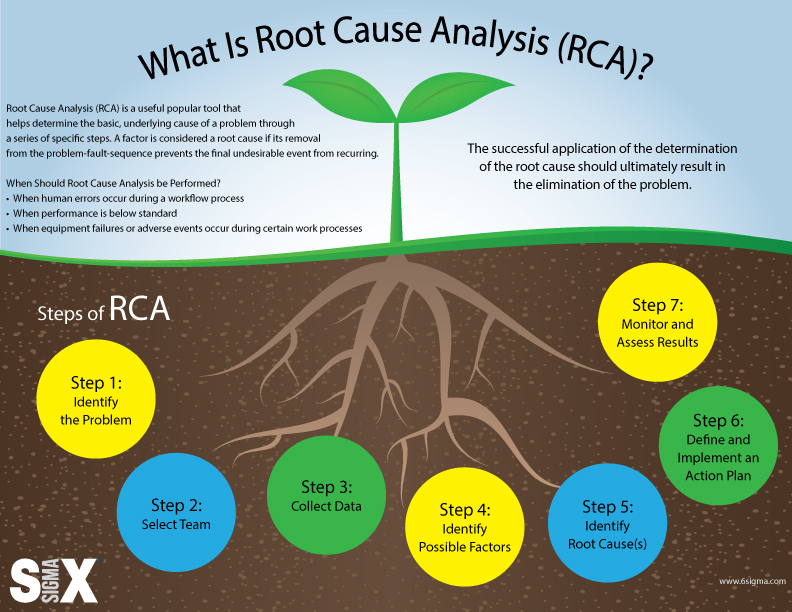
Image from:6sigma
Key Characteristics:
- Comprehensive Approach: Involves identifying, analyzing, and addressing the root causes of problems rather than just treating symptoms.
- Techniques: Utilizes various tools and methods such as the Fishbone Diagram, 5 Whys, and Failure Mode and Effects Analysis (FMEA) to explore and resolve issues.
- Focus on Prevention: Aims to implement solutions that address the root causes to prevent future problems.
Common Uses:
- Incident Investigation: Analyzes incidents or failures to understand underlying causes and prevent recurrence.
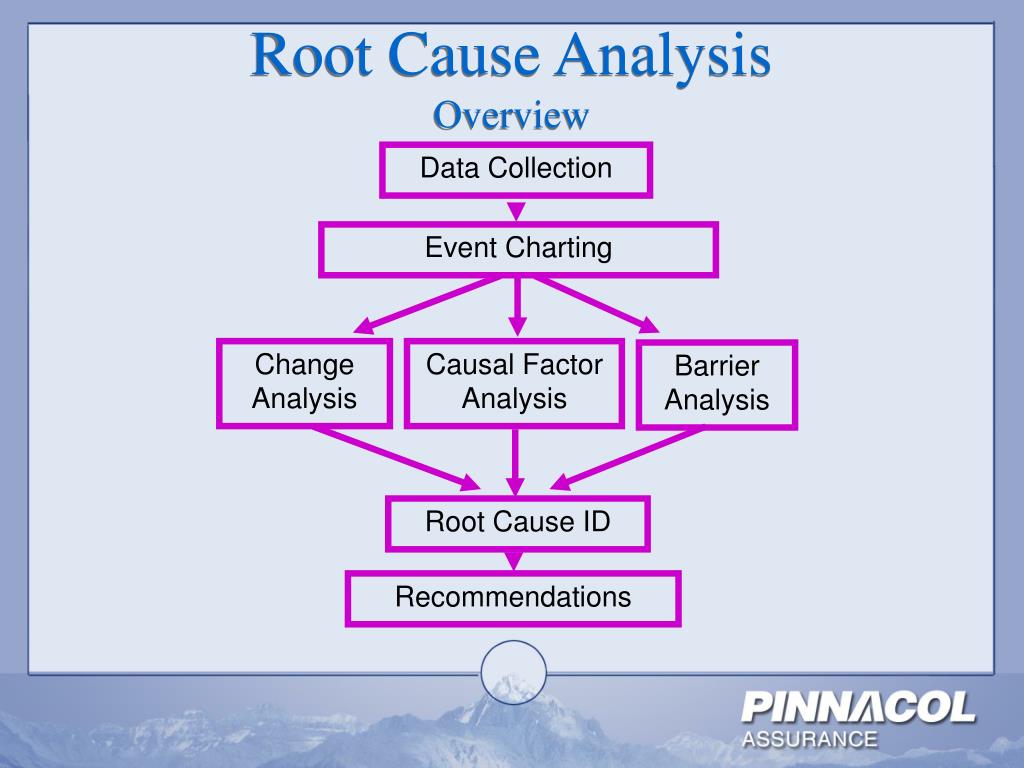
Image from:mungfali
- Process Improvement: Identifies and eliminates root causes of inefficiencies or defects in processes.
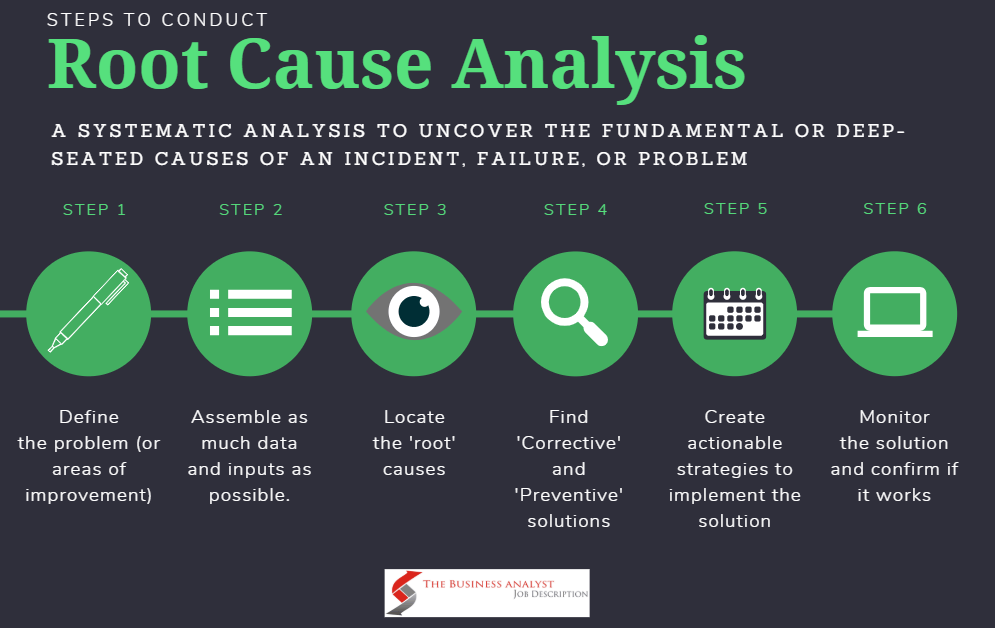
Image from:The business analyst Job descript
- Problem Resolution: Applies a structured approach to solve recurring issues across different fields.
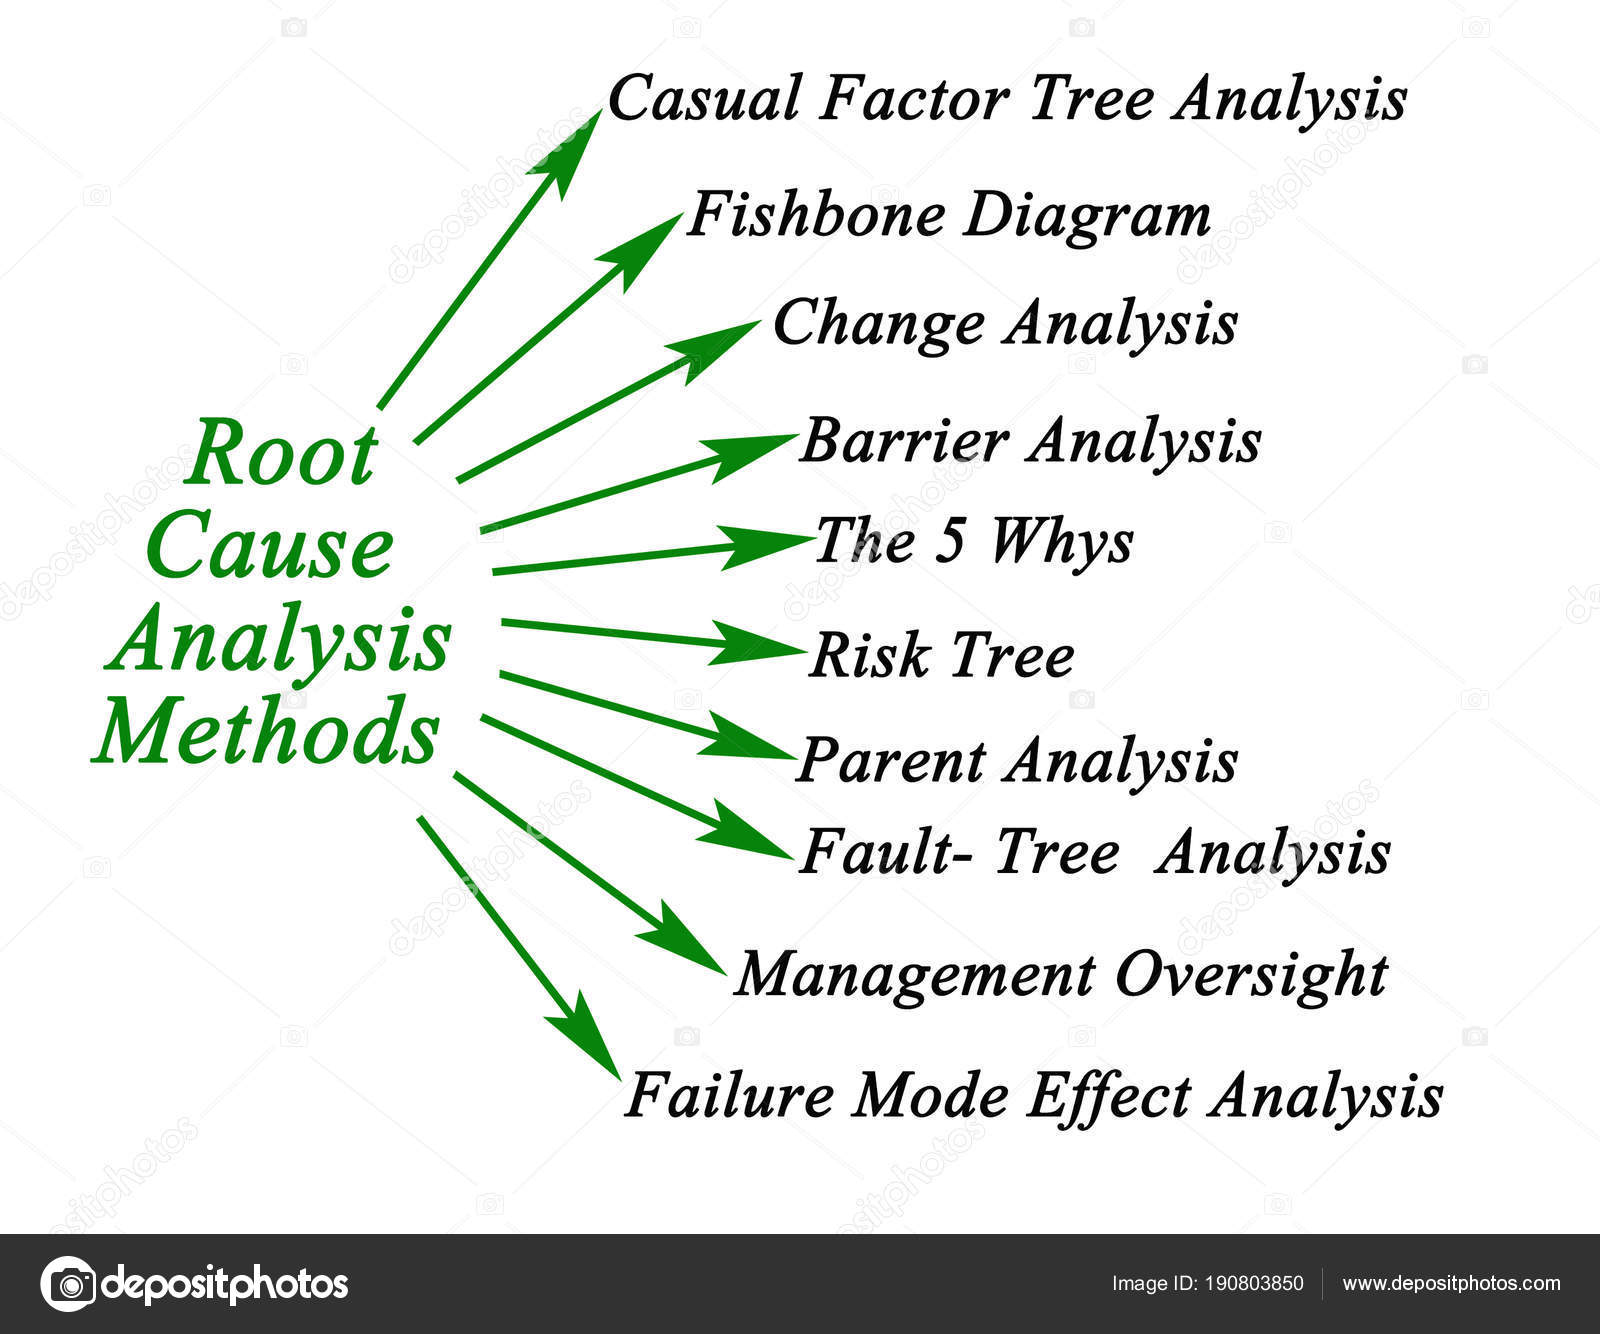
Image from:Excel-PMT
Visual Details:
- Steps: Includes problem identification, data collection, cause analysis, root cause identification, and solution implementation.
- Tools: May involve Fishbone Diagrams, 5 Whys, Pareto Analysis, and other analytical tools.
Applications:
- Aerospace: Used to investigate failures and enhance safety. For example, aerospace companies use RCA to analyze failures in aircraft components and improve reliability.
- Healthcare: Applied to understand and prevent adverse events. Hospitals use RCA to investigate incidents like patient falls or surgical errors to implement preventive measures.
- IT and Software Development: Helps in identifying and addressing software bugs and system failures. For instance, tech teams might use RCA to explore the causes of a critical system outage and improve system resilience.

Image from:Pinterest
Comparison Table
| Aspect | Fishbone Diagram (Ishikawa) | Root Cause Analysis (RCA) |
|---|
| Purpose | Visual tool for identifying potential causes of a problem | Comprehensive methodology for identifying and addressing root causes |
| Structure | Central spine with branches representing categories of causes | Process involving multiple techniques and tools |
| Focus | Cause-and-effect relationships within a specific problem | Overall approach to understanding and solving underlying issues |
| Common Tools | Fishbone Diagram, categories of causes | Fishbone Diagram, 5 Whys, FMEA, Pareto Analysis |
| Applications | Quality improvement, problem-solving, process analysis | Incident investigation, process improvement, problem resolution |
When to Use a Fishbone Diagram:
- Specific Problems: Ideal for analyzing and visualizing potential causes of a specific problem or defect.
- Structured Analysis: Useful for organizing causes into categories and understanding their relationships to the problem.
When to Use Root Cause Analysis:
- Comprehensive Investigation: Suitable for a thorough investigation of underlying issues that require multiple techniques and tools.
- Preventive Actions: Effective for identifying root causes and implementing solutions to prevent future problems.
Integrating Both Approaches:
- Combination: Often, the Fishbone Diagram is used as part of a broader Root Cause Analysis process to identify and explore potential causes, which are then analyzed further using additional techniques like the 5 Whys.
By understanding and applying these tools appropriately, you can effectively diagnose and address both the symptoms and the root causes of problems, leading to more sustainable and impactful solutions.
Conclusion
In conclusion, both the Fishbone Diagram and Root Cause Analysis are essential for effective problem-solving and quality improvement. The Fishbone Diagram offers a structured visual representation of potential causes, making it easier to organize and analyze contributing factors. Root Cause Analysis, on the other hand, provides a comprehensive approach to uncovering and addressing the fundamental causes of issues.
By understanding and applying these tools appropriately, you can enhance your ability to diagnose problems accurately and implement solutions that address both symptoms and underlying causes. Utilizing them effectively will lead to more sustainable improvements and better overall performance in your projects and processes.
Feel free to customize this content with specific examples or additional images to better suit your audience or industry, providing a clearer understanding of the Fishbone Diagram and Root Cause Analysis in various contexts.


.CHDSFvz6_ZBPvbh.webp)

.DHf_86pa_fvIJu.webp)