Flowcharts are essential tools for visualizing processes and making complex information more accessible. They come in various forms, with two prominent types being the traditional flowchart and the flowchart mind map. Understanding the differences between these two can help you choose the best approach for your specific needs. In this blog post, we will delve into the characteristics of each type, their advantages, and their ideal use cases.
Traditional Flowchart
What is a Traditional Flowchart?
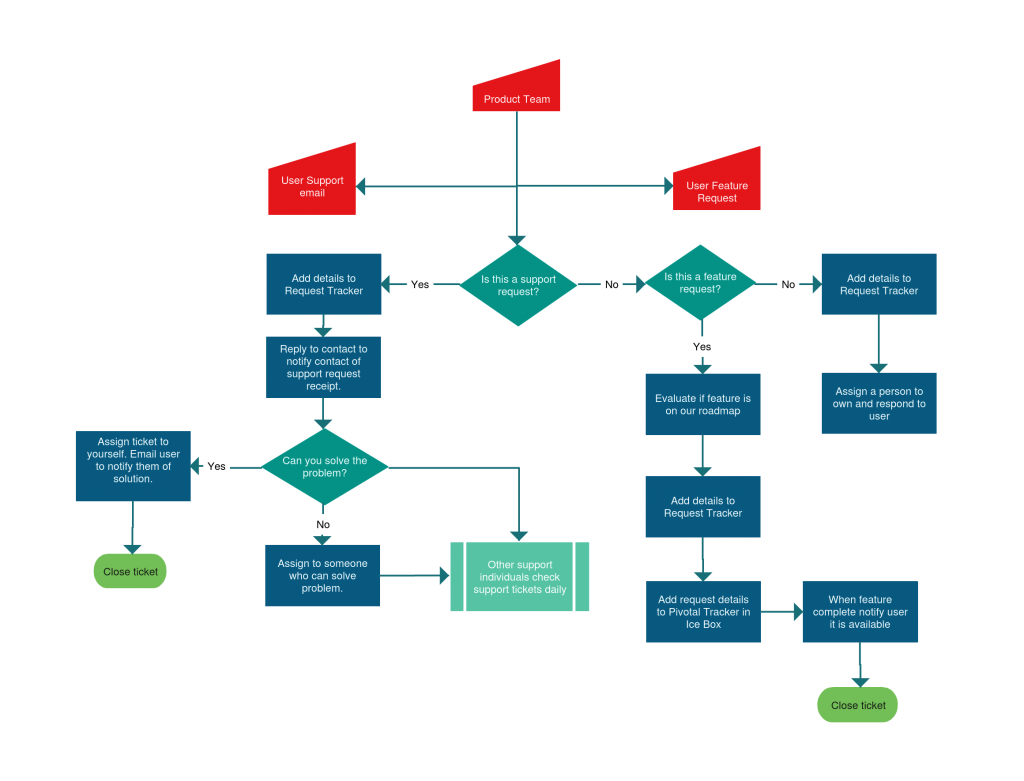
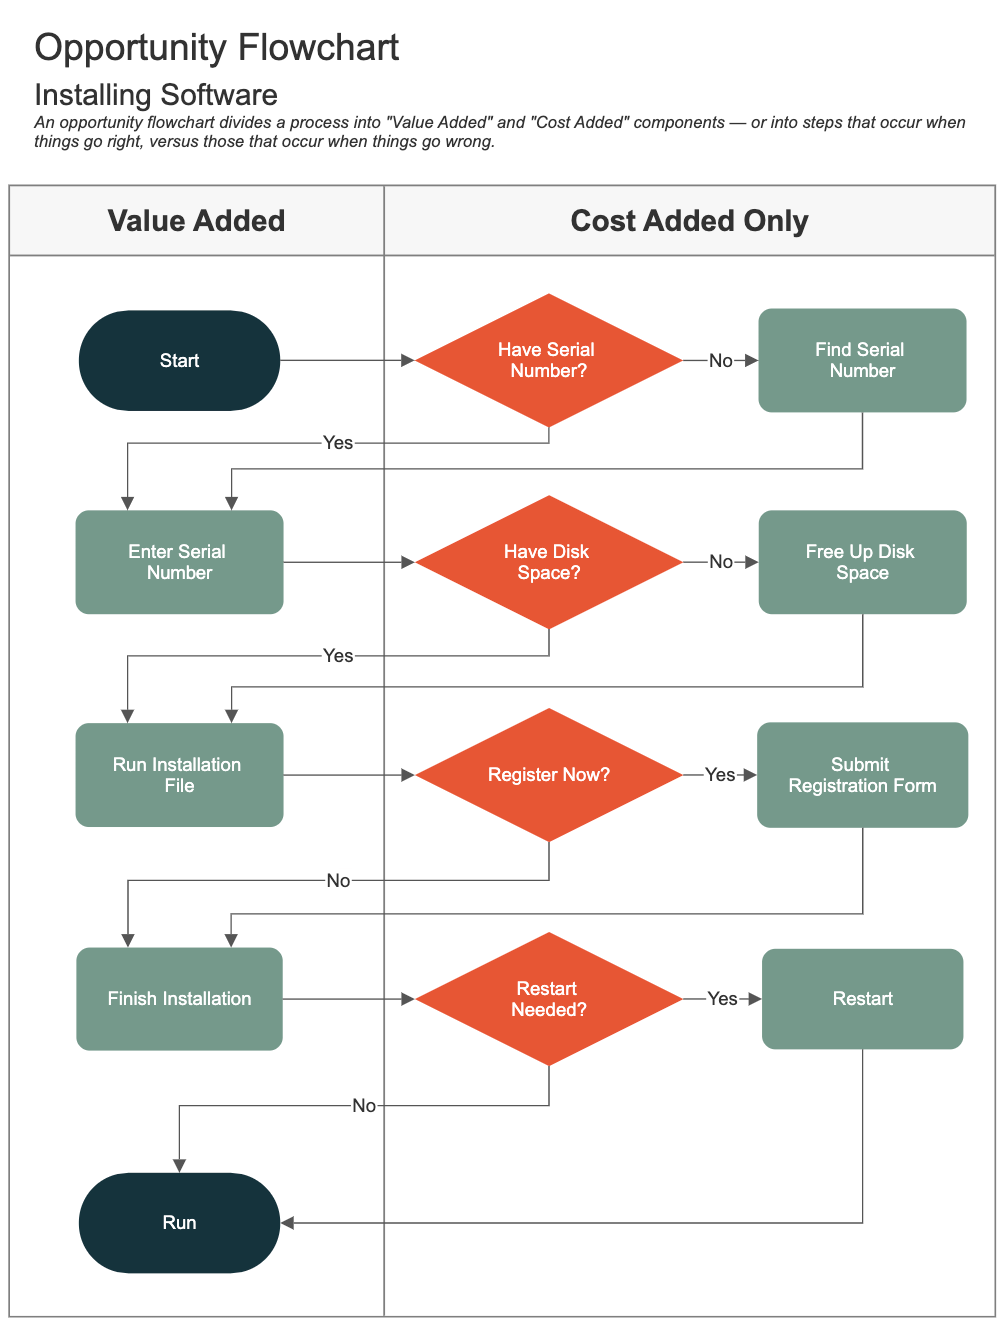
A traditional flowchart is a graphical representation of a process or system. It uses standardized symbols to depict steps, decisions, and the flow of control. The typical symbols include ovals (for start/end), rectangles (for processes), diamonds (for decisions), and arrows (for flow direction).

(Source:https://d3n817fwly711g.cloudfront.net/uploads/2012/06/New-Web-App-Support-Process-1024x781.png)
Image from:Pinterest
Key Features
Traditional flowcharts are known for their linear flow, which means they present processes in a step-by-step sequence. This linearity allows for a straightforward representation of procedures, where each step naturally follows the previous one. This structured approach is ideal for processes that are repetitive or follow a predictable pattern. For example, a flowchart depicting the steps of a customer service process—from receiving a complaint to resolving it—benefits from this linearity, as each stage depends on the completion of the previous one. The linear flow helps in visualizing the process clearly and ensures that all steps are accounted for, minimizing the risk of missing crucial elements.
One of the defining features of traditional flowcharts is their use of standardized symbols. These symbols—such as ovals for start and end points, rectangles for processes, diamonds for decision points, and arrows for flow direction—create a universally recognized language for process documentation. By adhering to these conventions, traditional flowcharts make it easier for individuals across various industries and professions to understand and interpret the information. For instance, a flowchart created for a manufacturing process can be easily understood by stakeholders from different departments or organizations due to the consistent use of symbols, facilitating effective communication and collaboration.
Traditional flowcharts excel in scenarios where sequential logic is paramount. This means they are particularly effective in processes that follow a clear, linear path from start to finish. Sequential logic ensures that each step is performed in a specific order, making it easier to track progress and identify potential bottlenecks or inefficiencies. For example, a traditional flowchart illustrating the steps of a software development lifecycle—from requirement gathering to deployment—benefits from this sequential approach. It allows team members to follow a structured pathway, ensuring that each phase of the project is completed before moving on to the next, which helps in maintaining organization and coherence throughout the process.
Advantages
Traditional flowcharts offer exceptional clarity due to their use of standardized symbols and a clear, linear structure. These standardized symbols—such as ovals for start and end points, rectangles for processes, diamonds for decisions, and arrows for flow direction—create a common visual language that transcends industry boundaries. This uniformity ensures that anyone familiar with flowchart conventions can easily interpret the information presented. For example, a flowchart detailing a company’s onboarding process for new employees can clearly delineate each stage—such as orientation, training, and final evaluations—using easily recognizable symbols. This clarity helps in minimizing misunderstandings and ensures that all stakeholders have a consistent understanding of the process. It also aids in training new team members, as they can quickly grasp the process flow through a visual representation.
Traditional flowcharts are designed to be straightforward and intuitive, making them accessible to a wide audience. The simplicity of creating and interpreting traditional flowcharts stems from their standardized format and clear sequence of steps. Most people can quickly learn the basic symbols and rules for drawing flowcharts, which means that even those without specialized training can create effective process diagrams. For instance, a project manager might use a traditional flowchart to map out a project timeline, using rectangles to represent tasks, diamonds for decision points, and arrows to show task dependencies. This ease of use allows for rapid development and modification of flowcharts, making them a practical tool for both planning and communication. Additionally, many software tools and templates are available to simplify the creation of flowcharts, further enhancing their accessibility.
Traditional flowcharts are highly effective for documenting procedures and workflows in a structured and organized manner. By breaking down a process into individual steps and representing them visually, traditional flowcharts provide a comprehensive overview of how tasks are performed and how different components interact. This documentation is valuable for a variety of purposes, such as training new employees, ensuring consistency in task execution, and identifying areas for improvement. For example, a flowchart documenting a company’s customer support process can detail each step—from receiving a customer inquiry to resolving the issue and following up—ensuring that all team members follow the same procedures. This structured representation helps in maintaining process integrity and provides a reference point for evaluating process efficiency and making necessary adjustments. It also facilitates compliance with industry standards and regulations by clearly outlining the steps required for various procedures.
Ideal Use Cases
- Standard Operating Procedures (SOPs)
Documenting Procedures That Follow a Specific Sequence
Traditional flowcharts are particularly well-suited for documenting Standard Operating Procedures (SOPs) because they provide a clear, step-by-step visual representation of processes. SOPs are critical for ensuring that tasks are performed consistently and efficiently across an organization. By using a flowchart, organizations can outline each step of a procedure in a linear fashion, highlighting the sequence in which tasks should be completed.
For instance, a flowchart documenting the SOP for handling customer complaints might start with receiving the complaint, followed by steps such as logging the complaint, investigating the issue, resolving it, and then following up with the customer. Each step is represented by a distinct symbol, making it easy for employees to follow the prescribed process. This visual documentation helps in training new employees by providing a clear guide to the procedure, reduces the likelihood of errors by standardizing tasks, and ensures compliance with industry regulations or internal quality standards. Additionally, having a visual SOP allows for easier updates and adjustments to procedures as needed.
Visualizing Algorithms and Decision-Making Processes
Traditional flowcharts are highly effective for visualizing algorithms and decision-making processes because they break down complex sequences into manageable, visual components. An algorithm, which is a set of rules or steps designed to perform a specific task or solve a problem, can be represented in a flowchart format to illustrate the flow of operations and decisions.
For example, a flowchart used to design a sorting algorithm, such as QuickSort or MergeSort, can detail each step involved in the sorting process, including comparisons, splits, and recursive calls. By visually mapping out these steps, developers can better understand how the algorithm operates, identify potential inefficiencies, and communicate the algorithm’s design to others. This visualization is crucial during the development phase, as it helps in debugging and optimizing the algorithm. Additionally, flowcharts can serve as a valuable tool for educational purposes, as they provide a clear and intuitive way to teach algorithmic concepts and problem-solving strategies.
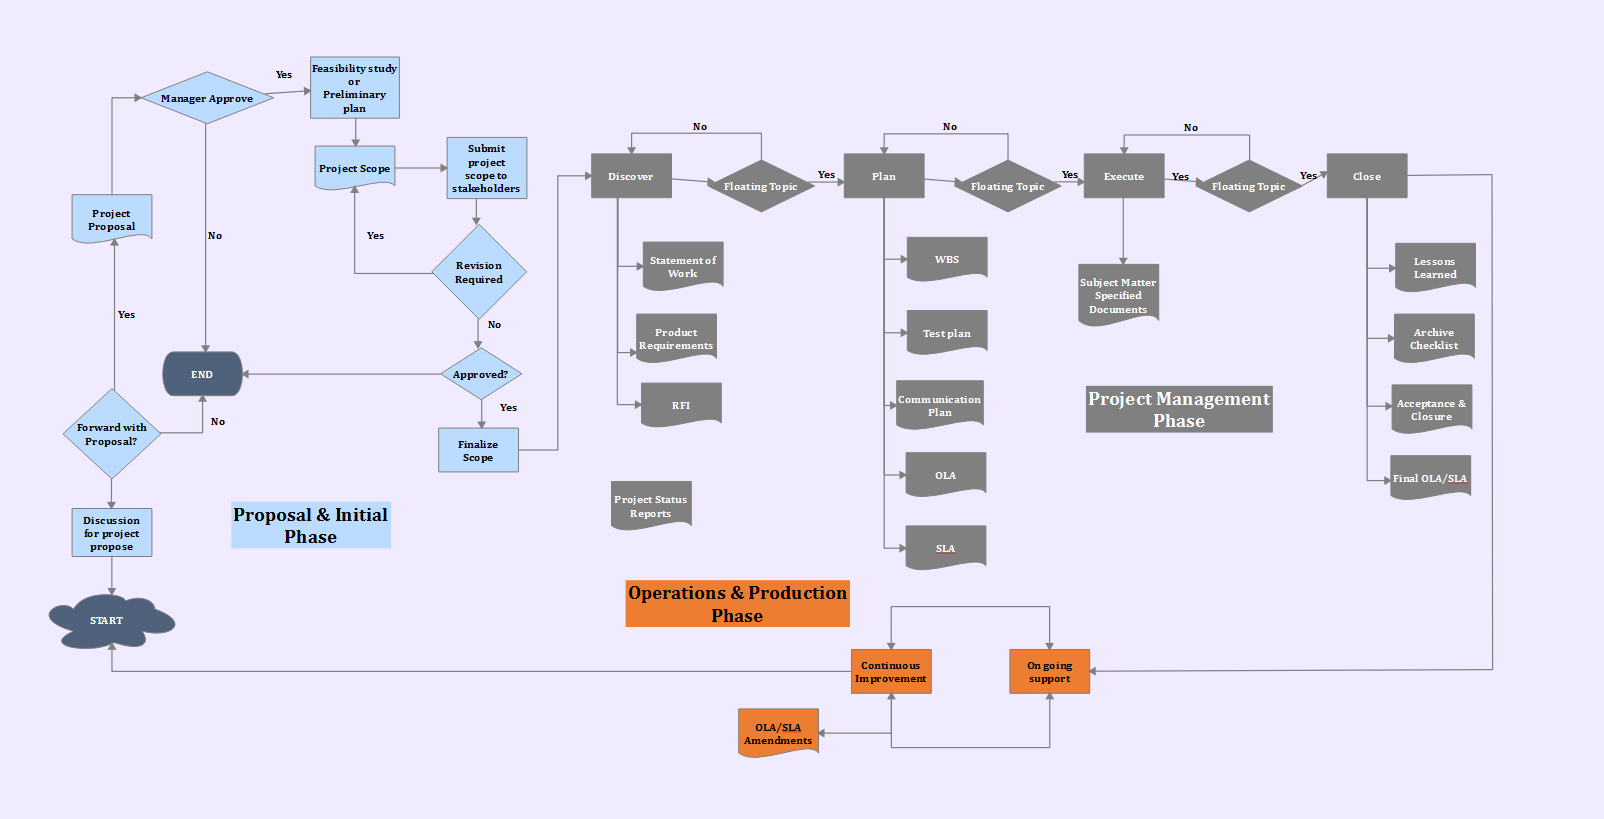
Mapping Out the Flow of Data and Control in a System
In system design, traditional flowcharts are instrumental in mapping out the flow of data and control within a system. They help in visualizing how different components interact and how data moves through various stages of a system. This is particularly useful for designing and understanding complex systems, such as software applications or organizational workflows.
For instance, a flowchart for a banking system might illustrate how customer transactions are processed, from the initial input of transaction data to validation, processing, and updating account balances. The flowchart would use symbols to represent various system components, such as input forms, processing units, and output displays, and arrows to show the flow of data between them. This visual representation aids system designers and developers in ensuring that all components work together seamlessly, helps in identifying potential issues or inefficiencies in the system, and facilitates communication among team members by providing a common understanding of the system’s structure and functionality. Additionally, flowcharts can be used for documenting system changes and improvements, ensuring that modifications are integrated into the overall system design effectively.
In summary, traditional flowcharts are invaluable for documenting SOPs, visualizing algorithms, and mapping out system designs due to their clarity, ease of use, and structured representation. Each use case benefits from the flowchart’s ability to provide a clear, linear depiction of processes and interactions, making it a versatile tool for various applications.

(Source:https://wcs.smartdraw.com/swim-lane-diagram/img/vertical-swimlane-2.png?bn=15100111938)
Image from:Smartdraw
Flowchart Mind Map
What is a Flowchart Mind Map?
A flowchart mind map combines elements of traditional flowcharts with mind mapping. It represents ideas and processes in a non-linear, radial format. This type of flowchart is less about sequential steps and more about relationships and connections between ideas.

(Source:https://www.imindq.com/wp-content/uploads/2021/07/flowchart-diagram-template.png)
Image from:iMind
Key Features
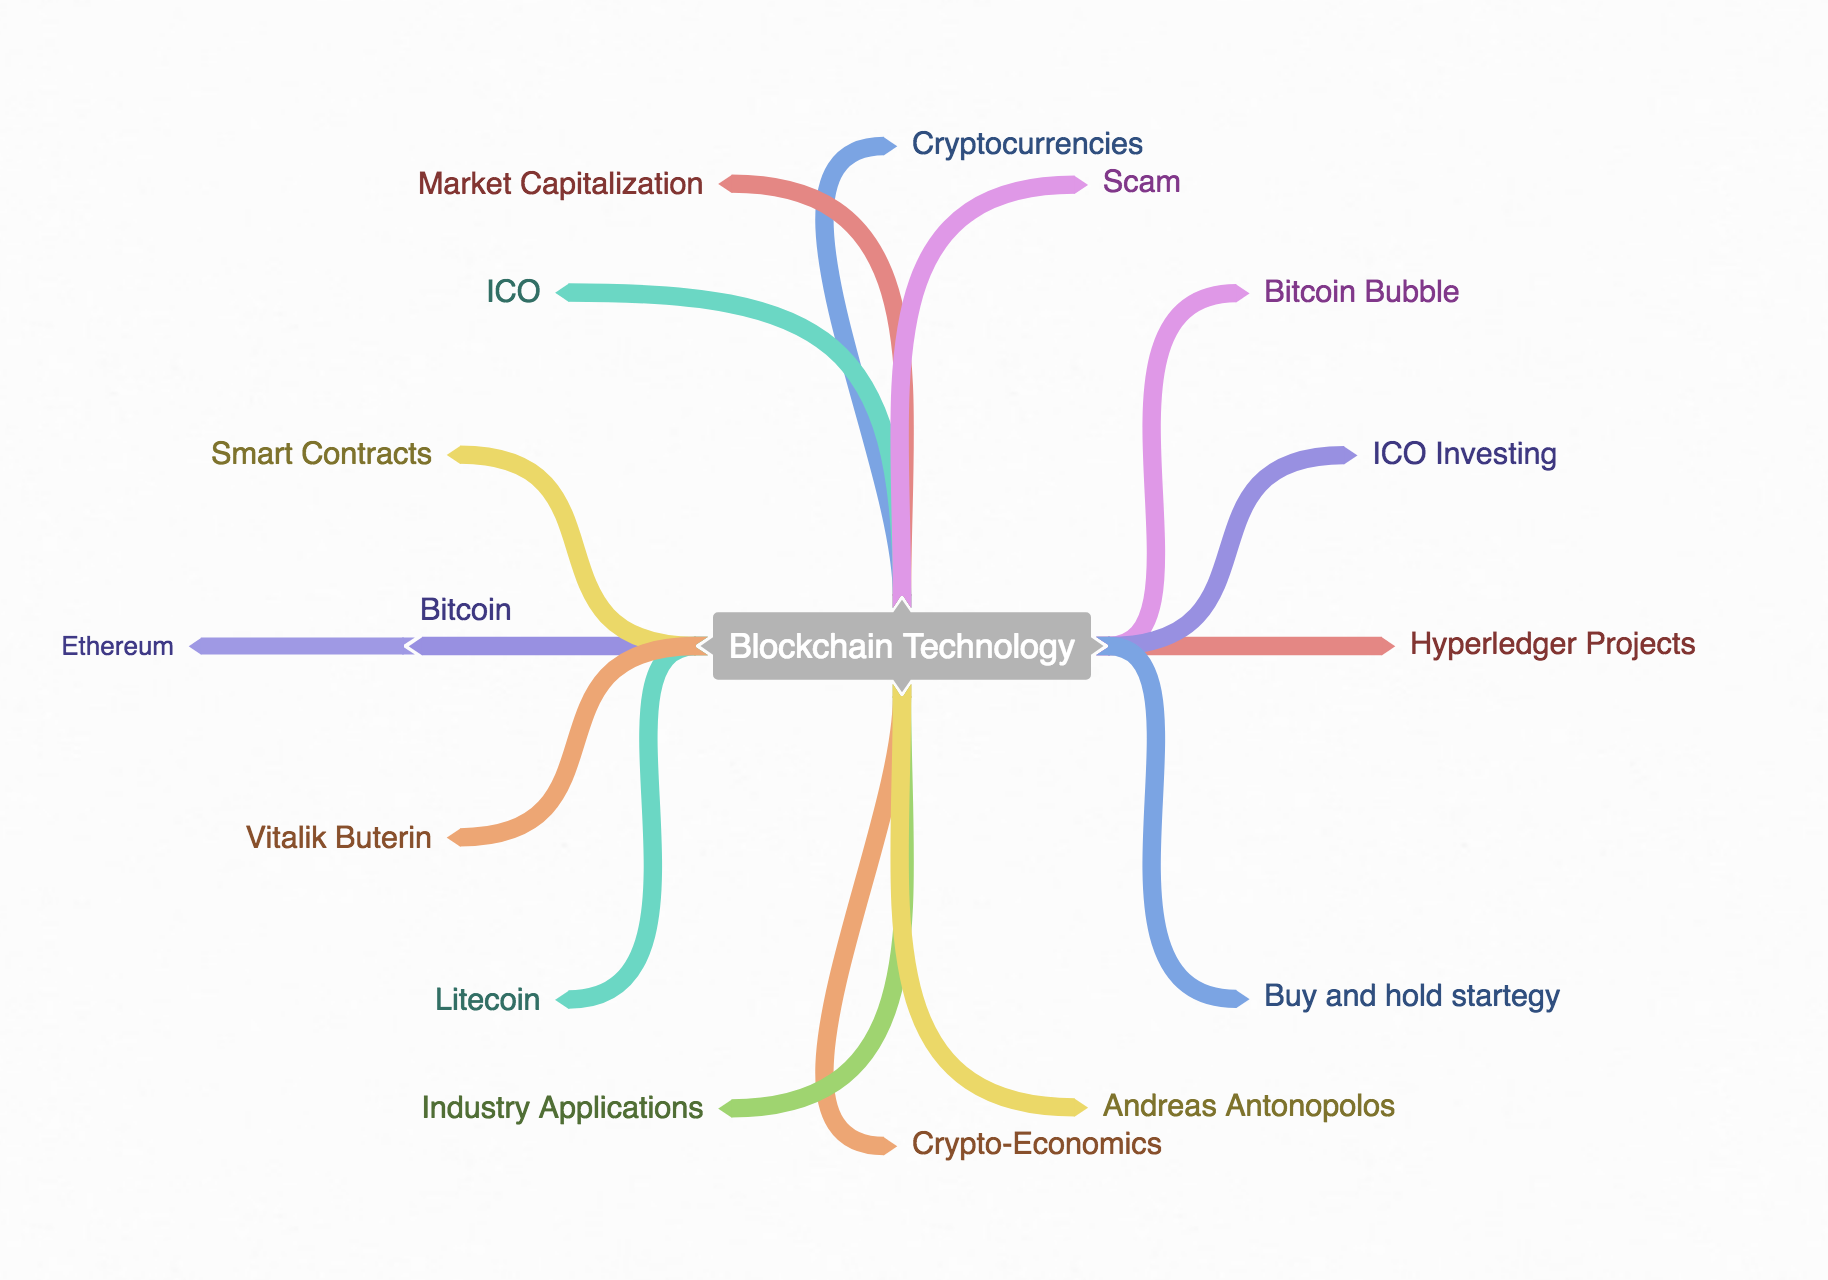
Ideas Are Arranged Around a Central Concept, Branching Out in a Non-Linear Fashion
Flowchart mind maps are characterized by their radial structure, where all ideas or components are arranged around a central concept. This layout differs significantly from the linear progression of traditional flowcharts, providing a more holistic view of the subject at hand. The central concept sits at the heart of the map, with related ideas and subtopics radiating outward in a non-linear fashion. This structure allows for a more dynamic representation of information, where multiple branches can develop simultaneously from the central node.
For example, when brainstorming for a new marketing campaign, the central node might represent the campaign’s main goal. From this central node, various branches could represent different aspects such as target audience, key messages, promotional channels, and budget. Each of these branches can further split into more detailed sub-branches, capturing all relevant information in a visually organized manner. The radial structure facilitates the exploration of ideas from multiple angles and encourages the discovery of new connections, making it particularly useful for complex topics that do not follow a linear sequence.
Allows for a More Flexible Representation of Processes and Relationships
One of the standout features of flowchart mind maps is their inherent flexibility. Unlike traditional flowcharts, which follow a linear and sequential path, mind maps offer a more adaptable format for representing processes and relationships. This flexibility is particularly beneficial when dealing with complex or dynamic subjects where the relationships between components are not strictly linear.
For instance, when planning a product development project, a mind map can be used to illustrate the various phases of development, from concept to launch. Each phase can have multiple branches representing different tasks, team members, and resources. The ability to add, modify, or rearrange branches easily allows for the incorporation of new information or changes in the project scope. This flexibility supports iterative planning and makes it easier to accommodate evolving requirements or unforeseen challenges. As a result, mind maps can effectively capture the fluid and interconnected nature of complex processes, making them a valuable tool for project management, strategic planning, and problem-solving.
Highlights the Connections and Hierarchy Between Various Components
Flowchart mind maps excel in highlighting the visual hierarchy and connections between various components. The radial arrangement not only displays how ideas are related to the central concept but also emphasizes the relative importance and relationships among different branches. This visual hierarchy helps in understanding how different elements fit into the overall structure and how they interact with each other.
For example, in a mind map used for organizing a corporate strategy, the central node might represent the company’s strategic goals. Major branches could represent key areas such as market expansion, product development, and operational efficiency. Sub-branches under each major area might detail specific initiatives, objectives, and metrics. The visual hierarchy makes it easy to see which components are central to achieving the goals and how various initiatives support each other. This clarity in hierarchy helps stakeholders understand the strategic focus and ensures that all elements of the plan are aligned with the overarching objectives. Additionally, it aids in identifying priorities and potential areas for improvement within the strategy.
In summary, the radial structure, flexibility, and visual hierarchy of flowchart mind maps provide a comprehensive and dynamic way to represent complex information. These features make mind maps particularly effective for brainstorming, project planning, and conceptualizing ideas, offering a more intuitive and adaptable approach compared to traditional linear flowcharts.

(Source:https://cbx-prod.b-cdn.net/COLOURBOX48652183.jpg?width=1600&height=1600&quality=70)
Image from:Colourbox
Advantages
- Creativity: Encourages creative thinking and exploration of different branches of a concept.
Flowchart mind maps are designed to foster creativity by providing a flexible and non-linear framework for exploring ideas. The radial structure, with a central concept at the core and branches radiating outward, encourages users to think divergently. Unlike traditional flowcharts that follow a set sequence, mind maps allow for the free association of ideas, enabling users to explore various aspects of a concept without being constrained by linearity.
For instance, during a brainstorming session for a new product, a mind map can help the team generate and visualize a wide range of ideas. Starting with the central concept of the new product, branches can represent different features, target markets, design elements, and marketing strategies. Each branch can further expand into sub-branches, capturing detailed ideas and possibilities. This approach not only helps in generating a broad spectrum of ideas but also in connecting seemingly unrelated concepts, leading to innovative solutions and novel approaches. The mind map’s structure inherently supports creative exploration, making it a valuable tool for ideation and creative problem-solving.
- Complexity Handling: Better suited for complex processes with many interrelated elements.
Flowchart mind maps excel in managing complexity by visually representing intricate relationships and interdependencies between various components. Unlike traditional flowcharts, which may become cumbersome when dealing with complex, multi-step processes, mind maps provide a more intuitive way to map out and understand complex systems.
For example, in a large-scale project involving multiple departments and interdependent tasks, a mind map can be used to illustrate how different elements are connected. The central node might represent the project’s overall objective, with branches detailing major milestones, deliverables, and stakeholder interactions. Each branch can further split into sub-branches, representing specific tasks, dependencies, and resources. This hierarchical and interconnected view makes it easier to grasp the full scope of the project, identify potential bottlenecks, and manage dependencies. The flexibility of mind maps allows users to add or adjust branches as the project evolves, making them well-suited for handling complex scenarios where traditional linear approaches might fall short.
- Organizational Flexibility: Adapts to changes and new information more easily than traditional flowcharts.
Flowchart mind maps offer superior organizational flexibility compared to traditional flowcharts. Their non-linear structure allows for easy modifications and updates, making them adaptable to changes and new information. This flexibility is particularly advantageous in dynamic environments where information and requirements are frequently changing.
For example, when planning a marketing campaign, a mind map can be continuously adjusted to reflect new insights, strategies, or market conditions. If new target demographics or marketing channels are identified, they can be seamlessly incorporated into the existing mind map by adding new branches or modifying existing ones. This adaptability ensures that the mind map remains relevant and useful as the campaign evolves. Additionally, the visual nature of mind maps helps in quickly communicating changes to team members, ensuring everyone is aligned with the latest information and strategies. This ease of adaptation supports iterative processes and ongoing refinement, making mind maps a valuable tool for managing projects and strategies in fast-paced or evolving contexts.
Ideal Use Cases
- Brainstorming Sessions: Visualizing various ideas and their interconnections.
Flowchart mind maps are particularly effective for brainstorming sessions because they allow participants to visually explore and organize a wide array of ideas and concepts. The radial structure of mind maps facilitates free-flowing thought, making it easier to capture and connect diverse ideas without being restricted by a linear format.
During a brainstorming session, starting with a central idea or challenge in the middle of the mind map, participants can generate and branch out different ideas related to the central theme. For example, if the central node is “New Product Development,” branches might include categories like “Features,” “Target Audience,” “Market Trends,” and “Competitive Analysis.” Each of these branches can further expand into sub-branches, detailing specific suggestions, insights, and research findings. This visual representation not only helps in capturing all ideas in one place but also highlights how different ideas are related, enabling participants to see patterns and connections that might otherwise be overlooked. This holistic view fosters creativity and helps in generating innovative solutions by making it easier to see how different elements interact and influence each other.
- Project Planning: Mapping out project components and their relationships.
In project planning, flowchart mind maps serve as a powerful tool for organizing and managing the various components of a project. The flexibility of mind maps allows project managers to map out different aspects of the project and their relationships in a non-linear format, which is especially useful for complex projects with many interdependent elements.
For example, when planning a software development project, a mind map can be used to outline major phases such as “Requirements Gathering,” “Design,” “Development,” “Testing,” and “Deployment.” Each major phase can then branch out into specific tasks, deadlines, team members responsible, and resource requirements. This approach provides a clear overview of the project’s structure, showing how different tasks and milestones are interconnected. It also allows for easy adjustments and updates as the project progresses, such as adding new tasks, reassigning responsibilities, or altering timelines. The visual nature of the mind map helps stakeholders quickly grasp the project’s scope and status, facilitating better communication and coordination among team members.
- Conceptualization: Understanding complex systems or processes that don’t follow a linear path.
Flowchart mind maps are ideal for conceptualizing complex systems or processes that have multiple interrelated components and do not follow a straightforward, linear path. The radial structure of mind maps enables users to represent and explore these systems in a way that captures their complexity and interconnectedness.
For instance, when conceptualizing an organizational structure, a mind map can start with the central node representing the organization and branch out into various departments, teams, and roles. Each branch can further detail specific functions, reporting lines, and interdepartmental relationships. This visual representation helps in understanding how different parts of the organization fit together and interact, highlighting both hierarchical relationships and collaborative connections. Similarly, when conceptualizing a complex scientific process, such as the water cycle, a mind map can illustrate how different stages (evaporation, condensation, precipitation) are interconnected, showing the cyclical nature of the process. This comprehensive view aids in grasping the overall structure and dynamics of the system, making it easier to analyze and communicate complex concepts.

(Source:https://steemitimages.com/DQmbd3F3RmWuCRkYnptDaxxxZ1ubJRuxazGeKoAimj9EBHF/Schermata%202017-12-28%20alle%2012.20.34.png)
Image from: steemit
Comparing the Two
| Feature | Traditional Flowchart | Flowchart Mind Map |
|---|
| Structure | Linear and sequential | Radial and non-linear |
| Symbols | Standardized symbols | Free-form nodes and connections |
| Complexity | Best for straightforward processes | Handles complex, interrelated ideas |
| Flexibility | Less adaptable to changes | Highly adaptable |
Choosing the Right Approach
The choice between a traditional flowchart and a flowchart mind map largely depends on the nature of your project and the type of information you need to represent.
- For Linear Processes: If your process is linear and sequential, a traditional flowchart might be the best choice. It’s straightforward and easy to follow.
- For Complex, Interconnected Information: If you’re dealing with complex concepts with multiple interconnections, a flowchart mind map provides the flexibility and depth needed to explore and understand these relationships.
Conclusion
Both traditional flowcharts and flowchart mind maps have their own strengths and ideal use cases. By understanding these differences, you can select the most effective tool for your specific needs, whether it’s documenting a simple process or exploring a complex set of ideas. Consider your goals and the nature of your project when making your choice, and remember that both methods offer valuable ways to visualize and manage information.


