When visualizing structures and organizing information, two powerful tools often come into play: Hierarchical Maps and Organizational Charts. Each serves distinct purposes and excels in different contexts. This blog explores their unique characteristics, differences, and practical applications to help you choose the right tool for your needs.
Hierarchical Maps are versatile tools designed to represent information in a layered, top-down structure. They are valuable for organizing data from the most general to the most specific levels, making complex information more manageable and understandable.
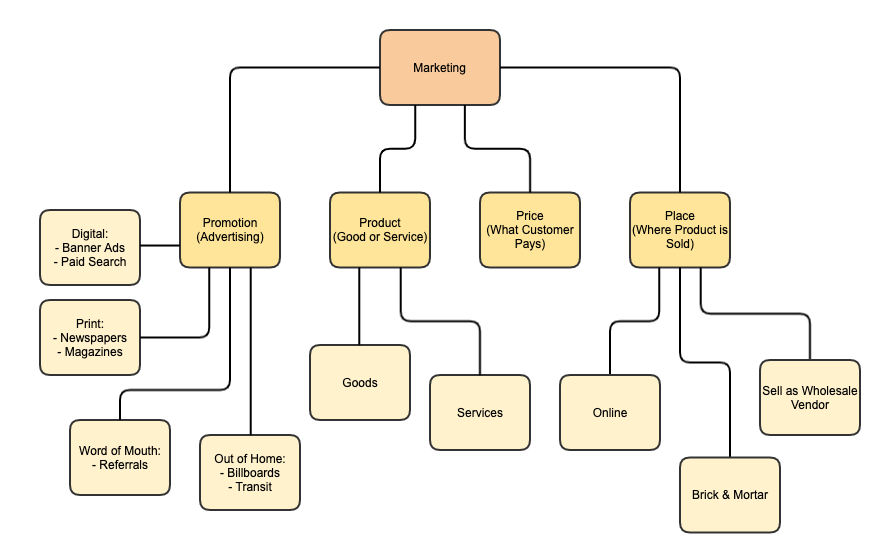
Image from:mavink
Key Characteristics:
- Layered Layout: Arranges information in concentric layers or nested levels, with the broadest categories at the top and more detailed elements below.
- Versatility: Suitable for a variety of contexts beyond organizational structures, including strategic planning, educational frameworks, and project management.
- Visual Elements: Often features boxes, circles, or other shapes to represent different levels of information, with lines or arrows indicating relationships.
Common Uses:
- Strategic Planning: Illustrates goals and objectives in a tiered manner, helping teams understand the relationship between high-level strategies and detailed tasks.

Image from:Pinterest
- Educational Frameworks: Breaks down complex subjects into manageable levels, such as categorizing scientific concepts or historical events.

Image from:ResearchGate
- Project Management: Organizes project phases, tasks, and dependencies, providing a clear overview of how different components fit together.

Image from:vistacreate
Visual Details:
- Top Layer: Broad goals or major phases.
- Middle Layers: Sub-goals or detailed tasks.
- Bottom Layer: Specific actions or components.
Organizational Charts (Org Charts) specifically depict the internal structure of an organization. They illustrate the hierarchy of positions, departments, or teams, making it clear who reports to whom and how different roles are related.

Image from:Template lab
Key Characteristics:
- Hierarchical Structure: Displays positions or departments in a clear top-down format, showing reporting lines and levels of authority.
- Structured Format: Typically features a tree-like layout with boxes connected by lines, emphasizing reporting relationships and departmental interactions.
- Focused Use: Primarily used to illustrate organizational structure, management hierarchy, and internal reporting relationships.
Common Uses:
- Human Resources: Provides a visual representation of reporting lines and organizational hierarchy, aiding in HR functions like recruitment and promotions.

Image from:Template lab
- Onboarding: Helps new hires understand the company structure, key departments, and their immediate supervisors.

Image from:visme
- Internal Communication: Clarifies organizational roles and enhances communication by showing how departments and teams are interconnected.
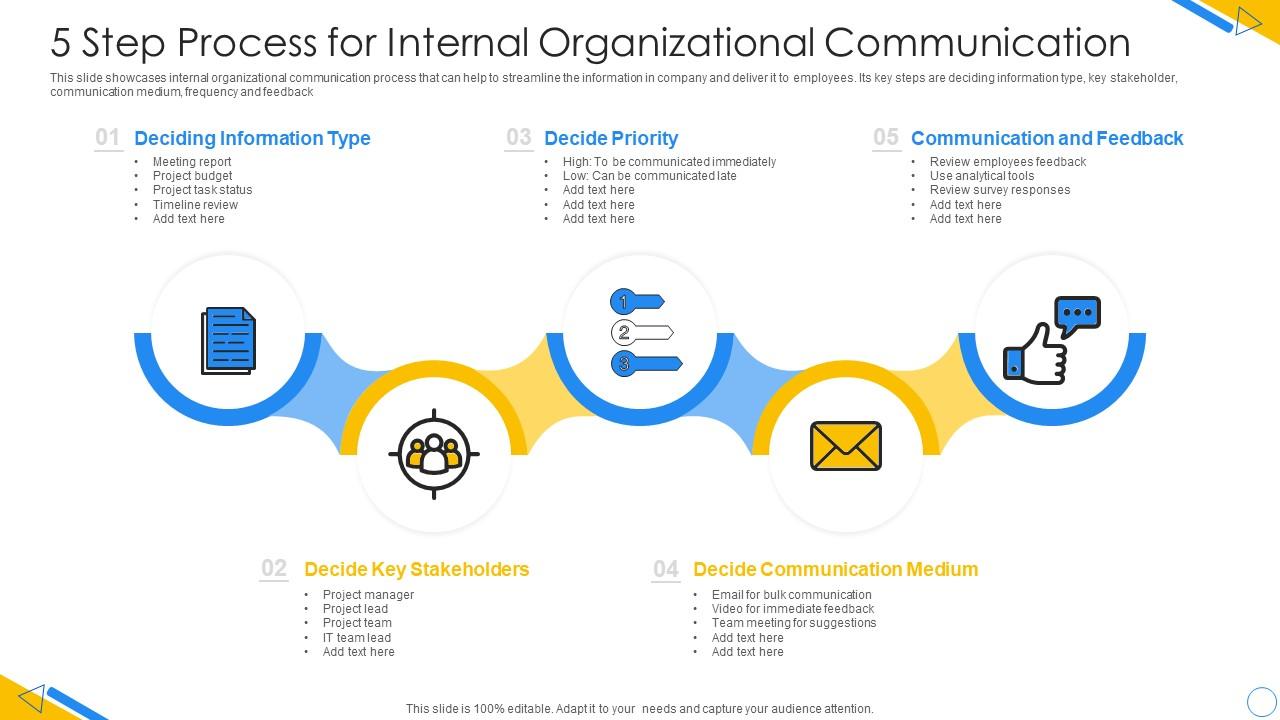
Image from:slideteam
Visual Details:
- Top Level: Senior management or executive team.
- Middle Levels: Department heads or team managers.
- Bottom Level: Staff members or teams.
Comparison Table
| Aspect | Hierarchical Map | Org Chart |
|---|
| Purpose | Organizes and visualizes information in a tiered format | Displays organizational structure and reporting lines |
| Structure | Layered or concentric circles; flexible | Tree-like with boxes and connecting lines |
| Focus | Relationships between different levels of information | Reporting relationships and management hierarchy |
| Use Cases | Strategic planning, educational frameworks, project management | HR management, onboarding, internal communication |
| Visual Representation | Multi-level layers or nested elements | Boxes with lines showing hierarchy |
| Flexibility | High; adaptable to various types of information | Low; focused on organizational roles and hierarchy |
To determine whether a Hierarchical Map or an Org Chart is more appropriate for your needs, consider the following:
- Nature of Information: For illustrating broad concepts with detailed breakdowns, a Hierarchical Map is ideal. If your goal is to depict the structure of an organization, an Org Chart is more suitable.
- Purpose: Use Hierarchical Maps for strategic planning and educational purposes where detailed layers are important. Opt for Org Charts to show organizational structure, management levels, and reporting relationships.
- Audience: Consider what your audience needs. Hierarchical Maps are useful for those needing an overview of complex information, while Org Charts are essential for understanding organizational dynamics and reporting structures.
Understanding these distinctions will help you effectively choose and utilize the appropriate tool for your specific context, ensuring clarity and efficient communication of information.
Conclusion
Hierarchical Maps and Organizational Charts are both valuable tools for visualizing information but serve different purposes:
- Hierarchical Maps are great for organizing complex, multi-level information, making them ideal for strategic planning, educational frameworks, and project management. They help break down broad concepts into detailed components.
- Organizational Charts specifically depict the structure within an organization, clarifying reporting lines and departmental hierarchies. They are essential for HR tasks, onboarding, and internal communication.
Choose Hierarchical Maps for detailed, multi-layered information and Organizational Charts for illustrating organizational structure and relationships. Using the right tool for your needs can significantly enhance clarity and effectiveness in managing and communicating information.


.DdCaW3aU_Z1UlSkj.webp)