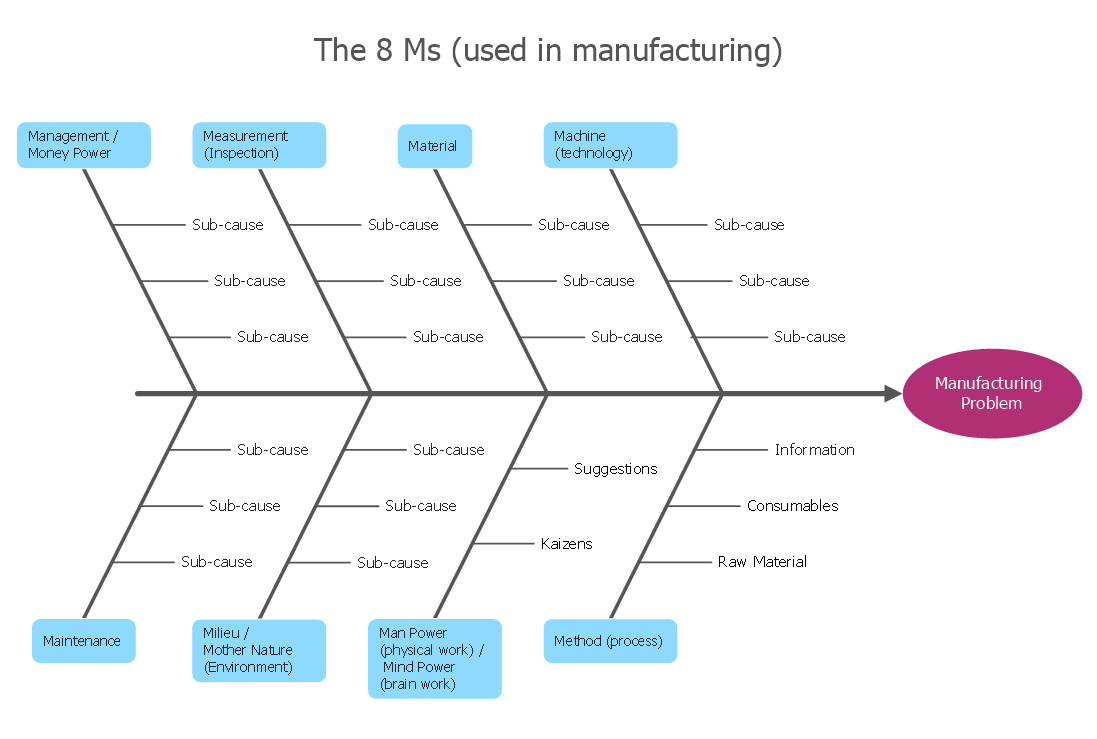
What is a Fishbone Diagram?
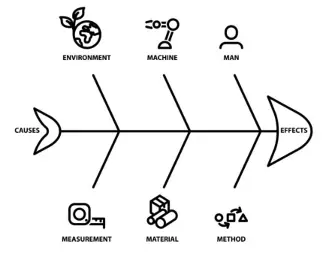
A Fishbone Diagram, also known as a cause-and-effect diagram or Ishikawa diagram, is a visual tool used for systematically identifying and analyzing the root causes of a particular problem. It resembles a fish skeleton, with the problem at the head and the causes extending as bones.
Purpose of Using a Fishbone Diagram
- Identify Root Causes
- Encourage Systematic Thinking
- Facilitate Brainstorming
- Promote Team Collaboration
- Visual Representation
Applications Across Industries
1. Manufacturing: Enhancing Product Quality
- Identifying Defects
- Process Optimization
- Quality Control
Case Study: An automobile manufacturer used a fishbone diagram to identify and resolve paintwork flaws, resulting in decreased defects and increased customer satisfaction.
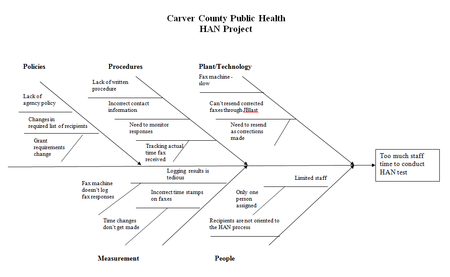
2. Healthcare: Improving Patient Safety
- Error Analysis
- Process Improvement
- Training and Education
Case Study: A hospital reduced patient fall rates by 30% in six months by using a fishbone diagram to identify and address contributing factors.

- Root Cause Analysis
- Cybersecurity
- Software Development
Case Study: An online retailer significantly improved website uptime by using a fishbone diagram to identify and fix causes of regular disruptions.

4. Education: Enhancing Teaching and Learning
- Teaching Effectiveness
- Curriculum Development
- Administrative Efficiency
Case Study: A high school improved math performance by using a fishbone diagram to identify and address issues in teaching methods and resources.
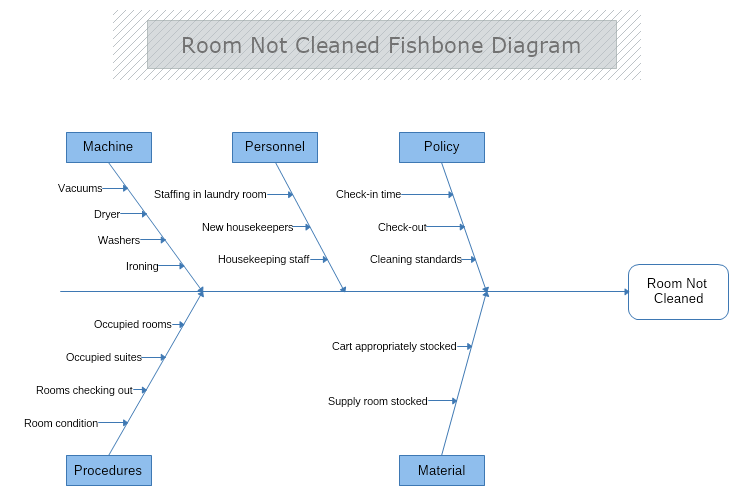
5. Hospitality: Enhancing Guest Experience
- Guest Satisfaction
- Operational Efficiency
- Staff Training
Case Study: A resort reduced check-in wait times and increased customer satisfaction by using a fishbone diagram to identify and resolve inefficiencies.

6. Finance: Enhancing Risk Management
- Risk Identification
- Customer Service
- Compliance and Auditing
Case Study: A bank improved loan processing times and customer satisfaction by using a fishbone diagram to identify and address bottlenecks.
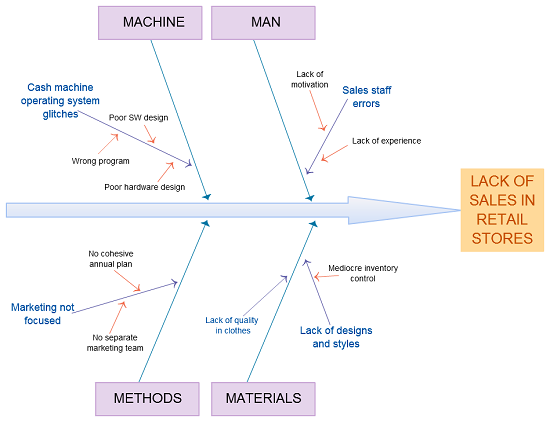
7. Retail: Improving Customer Experience
- Customer Experience
- Supply Chain Optimization
- Inventory Management
Case Study: A retail chain improved stock availability and increased sales by using a fishbone diagram to identify and resolve inventory management issues.
Limitations of Fishbone Diagrams
- Complexity in Large Problems
- Not Quantitative
- Subjectivity
- Time-Consuming
Despite these limitations, Fishbone Diagrams remain powerful tools for problem-solving and process improvement across various industries, promoting collaborative brainstorming and systematic identification of root causes.


.CHDSFvz6_ZBPvbh.webp)