In view of the wide application and far-reaching influence of Hierarchy Diagrams in many disciplines, this paper aims to explore its construction principles and practical strategies. By systematically analyzing the design elements, construction process, and optimization techniques of Hierarchy Diagrams, this paper aims to provide readers with a comprehensive and practical methodology, which is designed to help readers of different backgrounds master the skills of constructing effective Hierarchy Diagrams.
1. Hierarchical Map
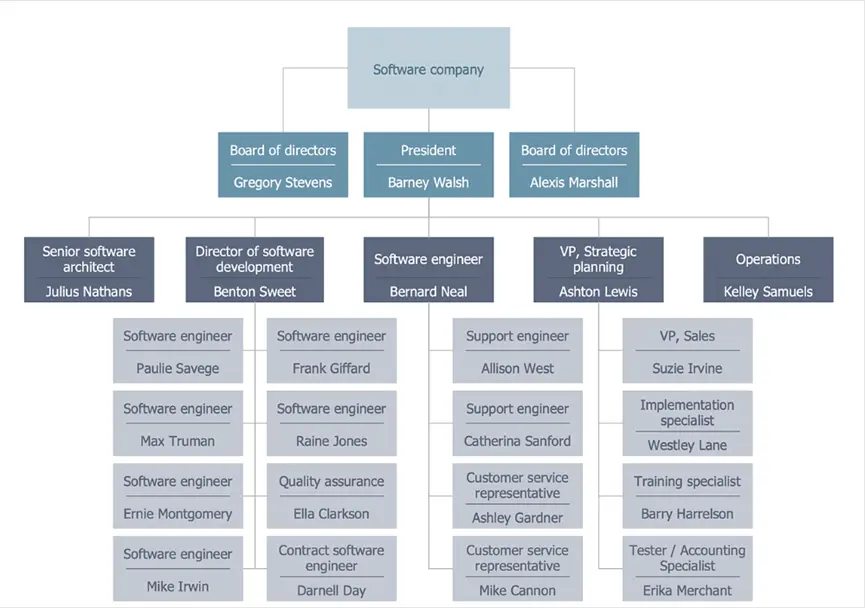
Hierarchical Map, as a visual tool for organizing and presenting information, its core concept is to construct an information network with a clear hierarchical structure through the logical connection between nodes and levels. This type of diagram can not only effectively reveal the intrinsic connection between information, but also significantly improve the readability and comprehensibility of information. In the field of project management, hierarchy diagrams are widely used in task decomposition, resource allocation and progress tracking, providing project managers with intuitive decision support; in organizational structure, it becomes an important tool for depicting the hierarchical relationships within the organization, departmental functions and reporting lines; in the field of data visualization, hierarchy diagrams become a key means of revealing the structure of complex data by virtue of their unique visual presentation, In the field of data visualization, Hierarchical Diagrams have become a key tool for revealing complex data structures and exploring the intrinsic laws of data by virtue of their unique visual presentation.
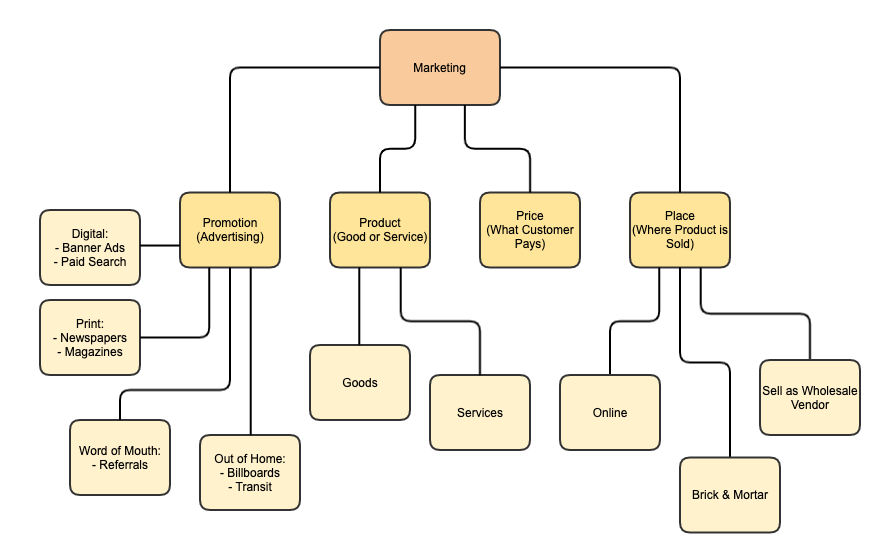
Image from: gliffy.com
2. Strengths and challenges
Hierarchical structure diagram shows significant advantages in information management and decision support. Firstly, it effectively improves the clarity and transparency of information through clear hierarchical division and logical display, and reduces the difficulty and cost of information interpretation. Secondly, the hierarchical structure diagram can intuitively reflect the association and dependence between information, providing decision makers with a comprehensive information perspective and in-depth insight ability, thus promoting a more scientific and rational decision-making process. However, with the increasing amount and complexity of information, Hierarchical Diagrams are facing the challenges of information overload and increasing complexity. How to maintain the integrity of information while effectively controlling the complexity of the chart and the amount of information has become a key consideration in the design of effective hierarchical charts. In addition, how to ensure the applicability and flexibility of hierarchical diagrams in different application scenarios is also one of the important challenges.
3. Systematic steps to build a hierarchy diagram
Step 1: Clarify objectives and scoping:
In the initial stages of constructing a hierarchy chart, the first task is to define its design purpose and intended function. This includes defining the specific problem that the hierarchy diagram is intended to address, the breadth and depth of information to be covered, and the intended audience. Clarifying the purpose and scope provides clear direction for subsequent steps and ensures that the hierarchy diagram is built around the core requirements.
Step 2: Key element identification and classification:
Subsequently, the target information system needs to be comprehensively analysed to identify the key elements that make up the system. These elements may represent different phases of the project, various departments of the organizational structure, various types of data in the dataset, and so on. In the identification process, emphasis should be placed on the representativeness and independence of the elements to avoid redundancy and repetition. At the same time, according to the nature and function of the elements, they should be initially categorized to lay the foundation for the design of the subsequent hierarchical structure.
Step 3: Hierarchical structure design and optimization:
Based on the logical relationship between the elements and the classification results, designing a reasonable hierarchical structure is the core of constructing a hierarchical structure diagram. This step requires in-depth analysis of the intrinsic connections and dependencies between the elements, and assigning the elements to different hierarchies based on these relationships. In the design process, the clarity and logic of the hierarchy should be emphasized to ensure that each element can be accurately categorized into the corresponding hierarchy and reflect the overall structure and organization of the information system. At the same time, the hierarchical structure needs to be continuously optimized to balance the level of detail of the information and the complexity of the charts.

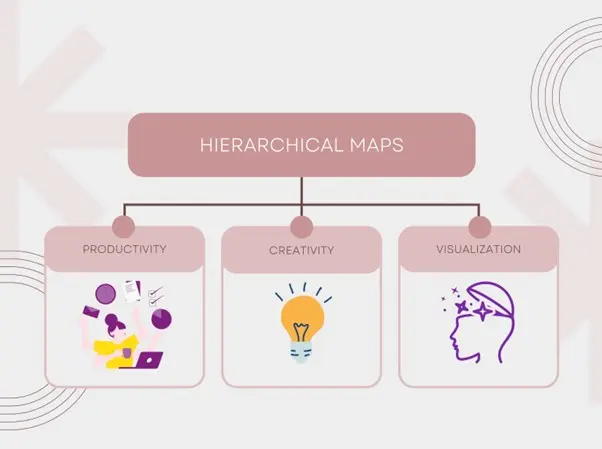
Image from:https://mavink.com
Step 4: Connection line drawing and relationship expression:
As an important means of representing the relationship between elements in the hierarchy diagram, the drawing of connecting lines should follow the principles of clarity and accuracy. In the drawing process, according to the actual relationship between the elements (such as hierarchical relationship, inclusion relationship, etc.), the appropriate type and direction of the connecting lines should be selected to visualize the path of association between the elements. At the same time, it is also necessary to pay attention to the layout and arrangement of the connecting lines, avoiding the phenomenon of crossover, overlap, etc., in order to ensure that the chart is neat and beautiful.
Step 5: Review and adjust for improvement:
Finally, a comprehensive review and adjustment of the completed hierarchy chart is a key step in ensuring its quality. In the audit process, every detail of the diagram should be carefully checked, including the accuracy of the information, the reasonableness of the hierarchy, the correctness of the connecting lines and other aspects. For the problems and deficiencies found, timely adjustments and optimization should be made. In addition, the hierarchy chart should be continuously improved and updated according to the feedback and changing needs of the target audience, so as to ensure that it always meets the actual needs and maximizes its effectiveness.
4. An In-Depth Analysis of Hierarchical Diagram Optimisation Strategies
Streamlining and centring strategy: Implementing the principle of streamlining in a complex information system means eliminating redundant and non-critical details through a rigorous filtering mechanism and focusing on the core elements of the information architecture. This process requires an in-depth analysis of the hierarchical relationships and importance weights of information, and the adoption of the “Occam’s Razor” principle (i.e., “if not necessary, do not add entities”) to ensure that the hierarchical structure chart carries the most critical information in the fewest number of elements, and achieves a high degree of information density and clarity. clarity.
Symbolization and color coding techniques: The use of symbols and colors is an effective means of enhancing the readability of hierarchical diagrams. Through a well-designed symbol system, different categories of elements can be intuitively distinguished or specific logical relationships can be expressed, such as the use of arrows to indicate the direction of flow, different shapes representing different types of entities, and so on. At the same time, colour coding techniques can further emphasize the hierarchy and priority of information, use the principles of colour psychology to guide the viewer’s attention, and enhance the depth and speed of information comprehension.
In-depth implementation of the principle of consistency: In the process of constructing a hierarchical structure diagram, adherence to the principle of consistency is essential to maintaining the coherence and comprehensibility of the information. This includes a unified naming convention to ensure the accuracy and consistency of all element names and avoid ambiguity; a standardized symbol system so that elements of the same type have a unified visual representation in the diagram; and a unified application of formatting conventions, such as fonts, font sizes, and spacing, etc., to ensure the harmony and balance of the overall layout. The adherence to the principle of consistency helps the viewer to quickly establish the correlation between information and enhances the efficiency of information processing.
Scalability design considerations: The hierarchical structure chart should have the ability to flexibly adjust as the amount of information grows or needs change. Scalability design aims to build the structure chart through modularization or hierarchical approach, which makes it easy to expand or contract the level of detail of a specific part according to the needs while maintaining the stability of the overall framework. This design strategy is not only conducive to maintaining the timeliness of information, but also meets the needs of information display in different scenarios, and improves the adaptability and practicality of the hierarchical structure diagram.
5. Exploration of interdisciplinary perspectives
Hierarchy of social science fields
In the social sciences, hierarchy diagrams are often used to show complex systems such as social structures, organizational relationships, and theoretical models. For example, in sociological studies, researchers can use hierarchy diagrams to depict social classes, occupational distributions, or family structures; in the field of political science, it can be used to represent the hierarchical relationships of governmental organizations or policy decision-making processes. These applications not only help researchers clearly present complex social phenomena, but also facilitate the construction and validation of theoretical models.
Hierarchy of natural science fields
Hierarchical diagrams are also widely used in the natural sciences to organize and present information. In biology, biological taxonomy uses hierarchical structure diagrams to show evolutionary relationships between species and classification systems; in chemistry, molecular structure diagrams are a special kind of hierarchical structure diagrams used to describe the connections and arrangements between atoms and molecules. These applications not only simplify the representation of complex natural phenomena, but also facilitate scientific discovery and knowledge dissemination.

Image from:zenflowchart.com
Hierarchical structure of engineering and technology fields
The application of hierarchy diagrams is particularly prominent in the field of engineering and technology. In the field of system design, hierarchical diagrams are used to describe the components of a system and their inter-relationships, such as software architecture diagrams, network topology diagrams, and so on. These applications not only improve the efficiency and accuracy of engineering design, but also promote teamwork and communication.
Commonalities and Differences in Interdisciplinary Applications
Despite the differences in the specific applications of hierarchy diagrams in different subject areas, they also show some commonalities. For example, whether in social sciences, natural sciences or engineering and technology, hierarchical maps emphasize the hierarchical, structural and visual representation of information. At the same time, interdisciplinary applications also face some challenges, such as how to cross disciplinary boundaries to achieve effective integration and presentation of information, and how to meet the specific requirements of hierarchy diagrams in different disciplinary fields.
Well, we have comprehensively explored the construction and optimization strategy of Hierarchy Diagram above, from the definition, role, construction steps to optimization techniques for in-depth analysis. Through the steps of defining objectives and scope, identifying key elements, designing hierarchical structure, drawing connecting lines and reviewing and adjusting, it provides readers with a set of systematic methods for constructing hierarchical diagrams. Meanwhile, the importance of simplified focus, symbol color usage, consistency principle and scalability design in optimizing hierarchy diagrams is emphasized. Looking ahead, with the continuous development of information technology, hierarchical diagrams will show their application value in more fields and are expected to be constructed and optimized more efficiently through intelligent and automated means. We encourage readers to apply what they have learned in practice, continue to explore and innovate, and jointly promote the progress and development of hierarchical diagrams.