In the world of systems thinking and complexity analysis, systems maps and causal loop diagrams are essential tools for understanding and managing complex systems. While both serve to visualize and analyze system components and their interactions, they offer different perspectives and insights. This blog will delve deeper into the definitions of systems maps and causal loop diagrams, highlight their differences, and discuss their applications in greater detail.
A systems map is a visual representation designed to illustrate the various elements within a system and how they are interconnected. Key components of a systems map include:
- Nodes: Each node represents a distinct component or entity within the system. These could be physical components, processes, people, or abstract concepts.
- Links: These are lines connecting nodes, indicating the relationships or interactions between different components. Links help to visualize how elements are related and influence each other.
- Attributes: Additional details such as the type of relationship, strength, or direction of influence may be included to provide more context.

Image from:Academy for system change
Characteristics of Systems Maps
- Structural Focus: Systems maps emphasize the structure and arrangement of components within a system. They provide a visual framework to understand how different elements are interconnected.
- High-Level Overview: They offer a broad view of the system’s structure, focusing on key components and their interactions rather than the detailed dynamics of these interactions.
- Contextual Understanding: Systems maps help in contextualizing how different parts of a system work together to achieve overall functionality. They are useful for identifying key elements and understanding their roles within the system.
Example Applications
- Organizational Mapping: Visualizing the structure of an organization, including departments, teams, and their relationships, to better understand organizational dynamics.
- Ecosystem Analysis: Mapping out the interactions between different species and environmental factors within an ecosystem to study ecological relationships.
A causal loop diagram is a tool used to represent and analyze the feedback loops and causal relationships within a system. It typically includes:
- Variables: Key factors or elements within the system that influence or are influenced by other variables. Each variable is a crucial component of the system’s dynamic behavior.
- Arrows: These indicate the direction of causation between variables, showing how changes in one variable affect others.
- Feedback Loops: Arrows form loops to illustrate how variables influence each other in a cyclical manner. Feedback loops can be either positive (reinforcing) or negative (balancing), affecting the system’s behavior.
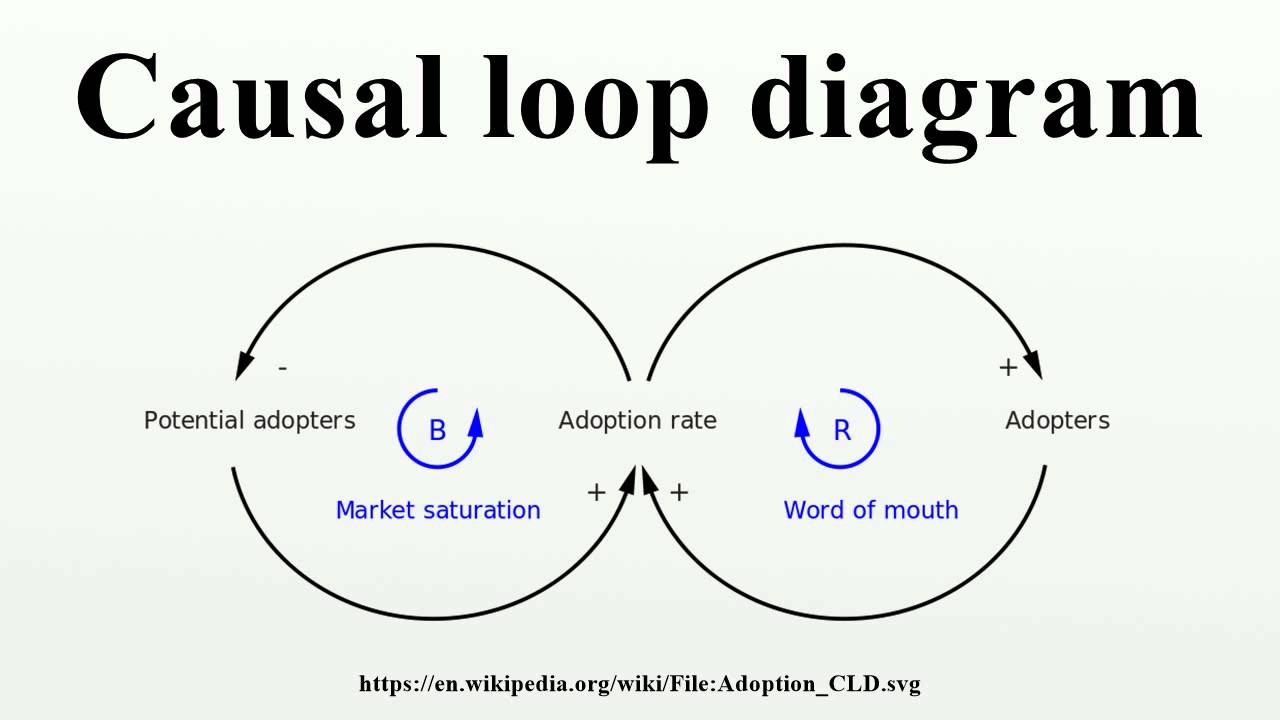
Image from:youtube
Characteristics of Causal Loop Diagrams
- Feedback Emphasis: Causal loop diagrams focus on feedback loops and causal relationships. They highlight how variables interact and how feedback can lead to reinforcing or balancing effects.
- Dynamic Analysis: They provide insights into the dynamic behavior of a system, showing how changes in variables propagate through the system over time.
- System Behavior: By illustrating feedback loops, causal loop diagrams help in understanding how the system evolves and responds to various changes or interventions.
Example Applications
- Business Process Improvement: Analyzing feedback loops in business processes to identify areas where improvements can be made to enhance efficiency and performance.
- Environmental Management: Studying feedback mechanisms in environmental systems to understand the impact of different factors on ecological balance and sustainability.
Key Differences Between Systems Maps and Causal Loop Diagrams
1. Purpose and Focus
Systems Maps:
- Structural Representation: Systems maps aim to depict the structure of a system, focusing on how different components are arranged and connected. They provide a broad view of the system’s layout and relationships.
- High-Level Overview: They are useful for understanding the overall configuration and key elements of the system without delving deeply into the dynamics of interactions.
Causal Loop Diagrams:
- Dynamic Analysis: Causal loop diagrams are focused on understanding the dynamics of a system by highlighting feedback loops and causal relationships. They provide insights into how variables interact over time and influence each other.
- Feedback Mechanisms: They are used to analyze feedback mechanisms, helping to understand how changes in one part of the system affect other parts and lead to feedback effects.
2. Representation of Relationships
Systems Maps:
- Simple Connections: Systems maps illustrate basic connections between components, showing how elements are related without detailing the direction or nature of causation.
- Visual Structure: They focus on the visual representation of the system’s structure, highlighting the arrangement and links between different components.
Causal Loop Diagrams:
- Directional and Causal: Causal loop diagrams depict the direction and nature of causation between variables. They show how changes in one variable impact others and how these interactions create feedback loops.
- Dynamic Interactions: They provide a detailed view of how variables influence each other and how feedback loops drive system behavior.
3. Complexity and Detail
Systems Maps:
- Broad Overview: Systems maps offer a high-level view of the system’s structure, focusing on key components and their relationships without extensive detail on the dynamics of interactions.
- Structural Analysis: They are used for analyzing the overall arrangement and connections within a system, providing insights into its structure and organization.
Causal Loop Diagrams:
- Detailed Dynamics: Causal loop diagrams provide a detailed analysis of the system’s dynamics, including feedback loops and causal relationships. They help in understanding how interactions between variables influence system behavior over time.
- Behavioral Insights: They offer insights into how the system evolves and responds to changes, identifying feedback mechanisms and potential leverage points
| Aspect | Systems Maps | Causal Loop Diagrams |
|---|
| Purpose and Focus | Structural representation of a system. | Dynamic analysis of feedback and causation. |
| Representation | Shows basic connections between components. | Depicts directional and causal relationships. |
| Complexity and Detail | High-level overview of structure. | Detailed view of dynamics and feedback loops. |
| Use Case | Understanding overall system layout. | Analyzing how variables influence each other over time. |
Applications of Systems Maps and Causal Loop Diagrams
Systems Maps Applications
- Systems Analysis:
- Organizational Structure: Analyze and improve the efficiency of organizational hierarchies and departmental interactions.
- Project Planning: Understand relationships among project components and stakeholders to ensure alignment and effective management.
- Strategic Planning:
- Strategic Alignment: Align strategies with operational components for cohesive organizational goals.
- Resource Allocation: Visualize resource distribution to optimize allocation and identify improvement areas.
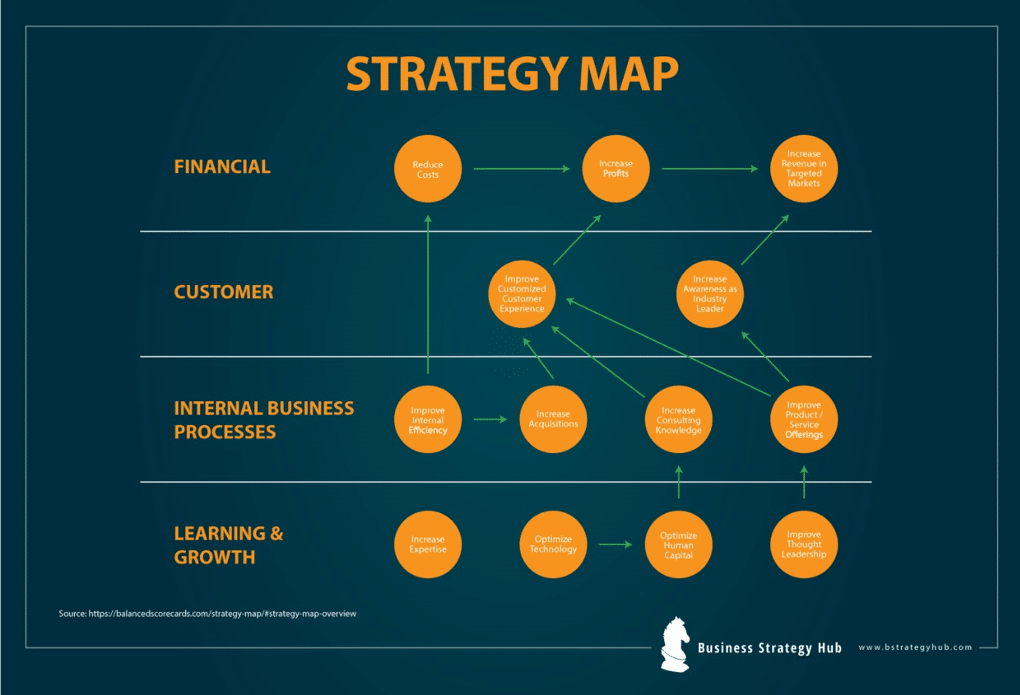 Image from:bstrategyhub
- Education and Training:
- Conceptual Understanding: Teach about the structure and interconnections within complex systems using visual tools.
- Curriculum Development: Design coherent educational curricula by mapping out key concepts and their relationships.
 Image from:biggerate
- Product Development and Innovation:
- Product Ecosystem: Visualize the complete ecosystem around a product, including stakeholders, to support strategic planning.
- Feature Analysis: Analyze interactions between product features and external factors to aid in design and development.
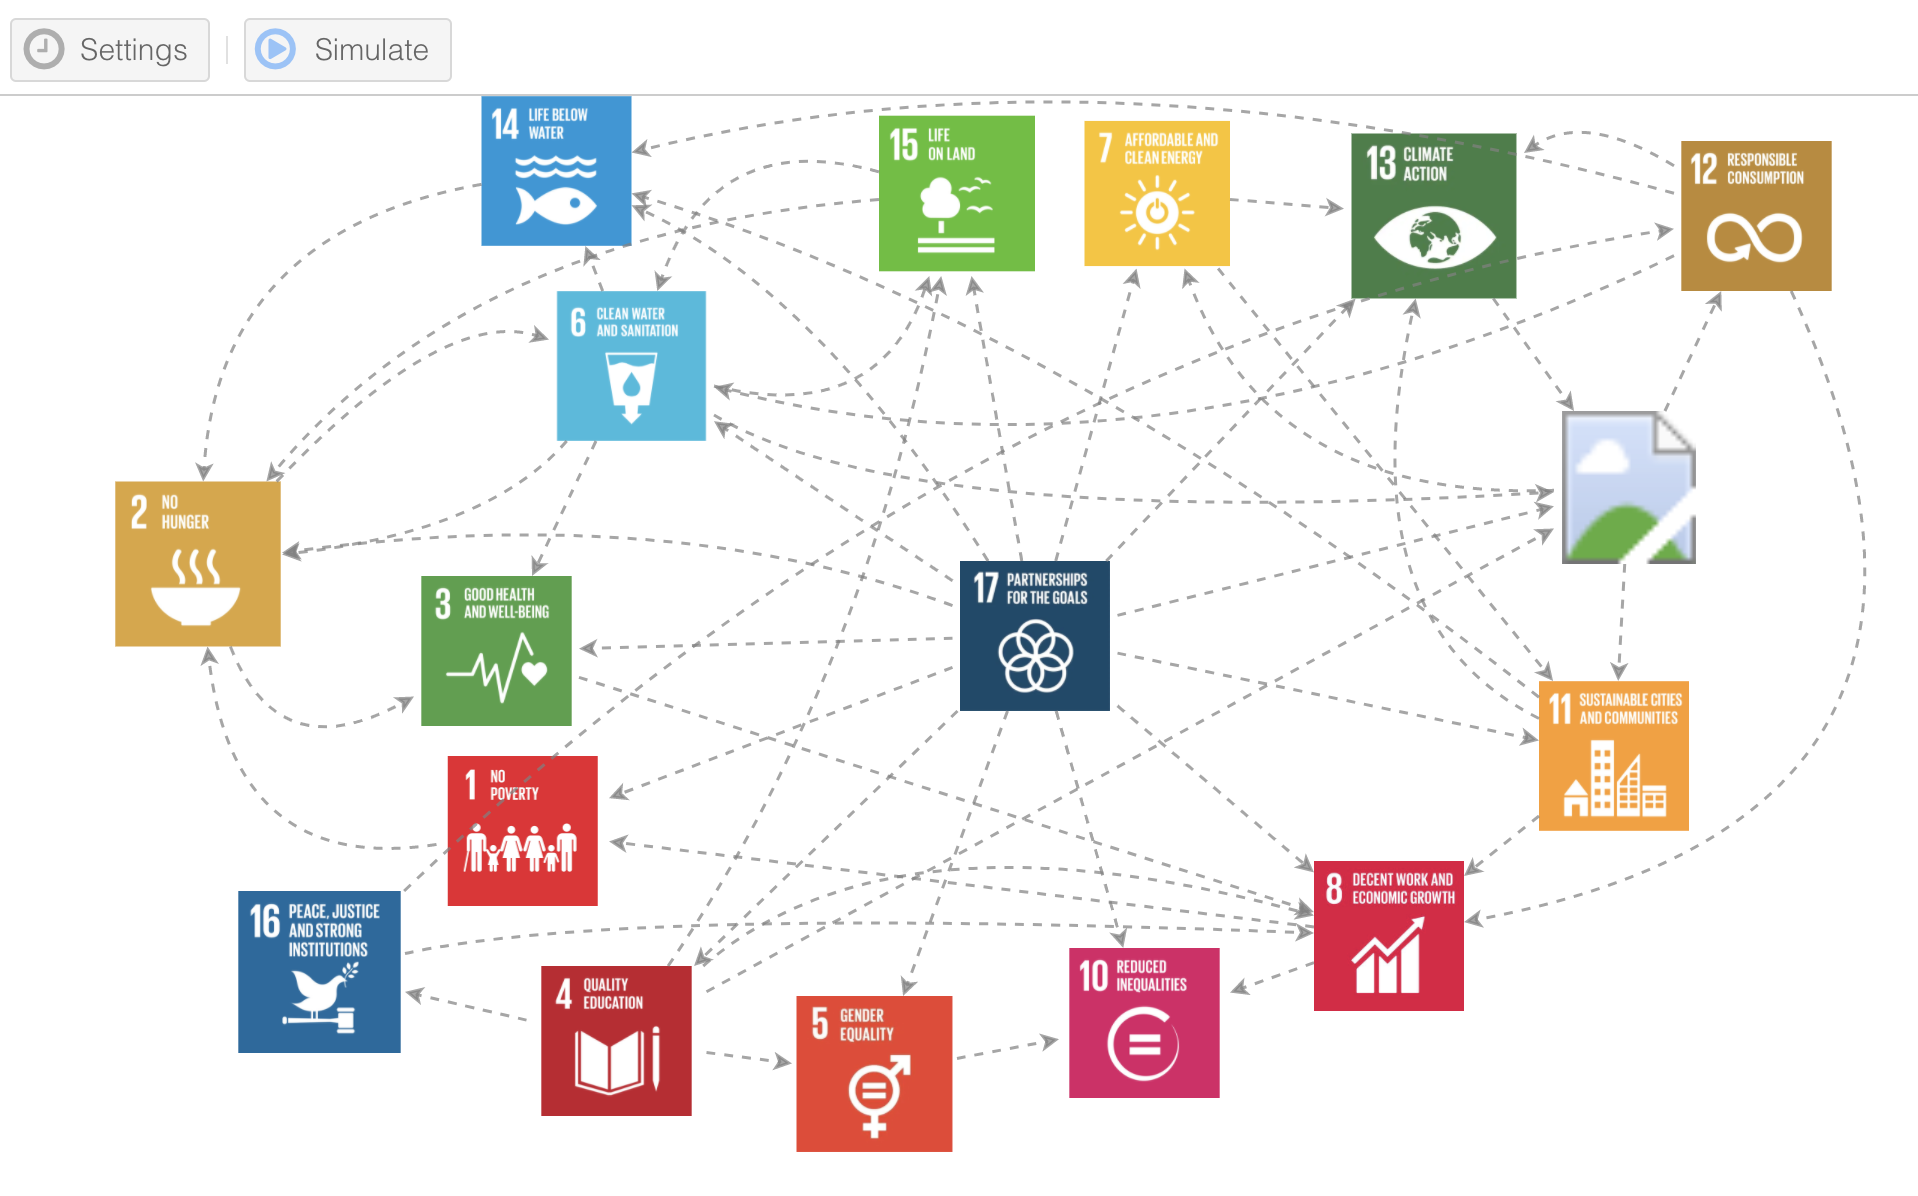
Image from:TRELLIS
Causal Loop Diagrams Applications
- Systems Analysis:
- Process Improvement: Identify inefficiencies and problems through feedback loops to design targeted improvements.
- Policy Analysis: Assess the impact of policy changes by understanding feedback mechanisms and informing better policy design.
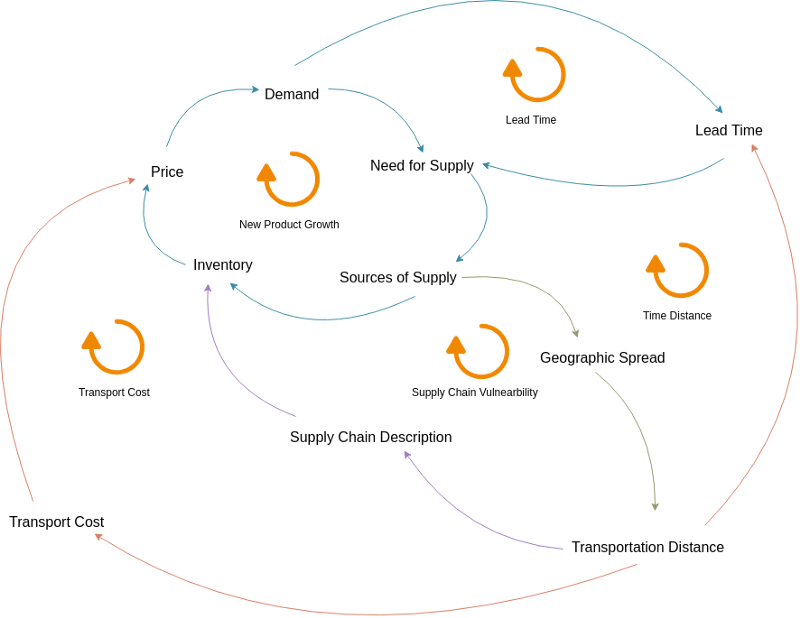
Image from:Cybermedian
- Strategic Planning:
-
Scenario Planning: Explore potential outcomes based on feedback loops and causal relationships to prepare for different scenarios.
-
Risk Management: Identify and manage risks by understanding how feedback mechanisms can impact risk levels.

Image from:templates
- Education and Training:
- Systems Thinking: Teach systems thinking and feedback analysis to understand how feedback loops influence behavior and decisions.
- Problem Solving: Enhance problem-solving by analyzing dynamic interactions and feedback effects to address complex issues.
 Image from:Visual Paradigm
- Product Development and Innovation:
- Innovation Design: Analyze feedback loops in innovation processes to identify leverage points and areas for enhancement.
- Product Performance: Understand how various factors influence product performance over time to optimize and improve the product.

Image from:ResearchGate
Conclusion
Both systems maps and causal loop diagrams are invaluable tools for understanding and managing complex systems, but they offer different perspectives and insights. Systems maps provide a high-level overview of a system’s structure and relationships, making them ideal for structural analysis and visualization. Causal loop diagrams, on the other hand, focus on the dynamic behavior of systems, emphasizing feedback loops and causal relationships to analyze how changes affect system behavior over time. By understanding the definitions, differences, and applications of each tool, you can effectively choose the right method for your needs, enhancing your ability to analyze, manage, and improve complex systems.


.CHDSFvz6_ZBPvbh.webp)

.DHf_86pa_fvIJu.webp)